14 Landsat Images Provided to the International Charter in October 2015
The International Charter is a system that supplies free satellite imagery to emergency responders anywhere in the world.

The International Charter is a system that supplies free satellite imagery to emergency responders anywhere in the world.
There is a global effort afoot to fight hunger and reduce poverty by allowing anyone with an internet connection to see agricultural projections.
Landsat 7, which launched on April 15, 1999, has been continuing to acquire land images worldwide for 16 years. Landsat 5 may hold the Guinness World Record for longest Earth-observing satellite at 28+ years, but Landsat 7 also has an impressive track record. In fact, Landsat 7 has now acquired over 2 million images.
The Oak Ridge National Laboratory DAAC, has just release a Landsat-based forest disturbance history covering the years between 1986 and 2010.
Ice sheets are in perpetual motion, making their way downslope like a river. If the amount of snow that an ice sheet accumulates does not keep pace with its loss to the sea, sea level will rise. As temperatures have climbed, positive feedback loops have led to an accelerated loss of ice sheet sections that touch the sea, but in an unexpected twist to the global warming saga, scientists have just discovered a negative feedback loop that is slowing down the Greenland Ice Sheet sections that end on land—a sliver of good news for sea-level rise.
WIRED Magazine’s Eric Klemetti wrote a blog post titled “The Loneliest Volcano on Earth” about Amsterdam Island in the Indian Ocean. In his post, Klemetti used a Landsat 8 image to show the lonesome volcano.
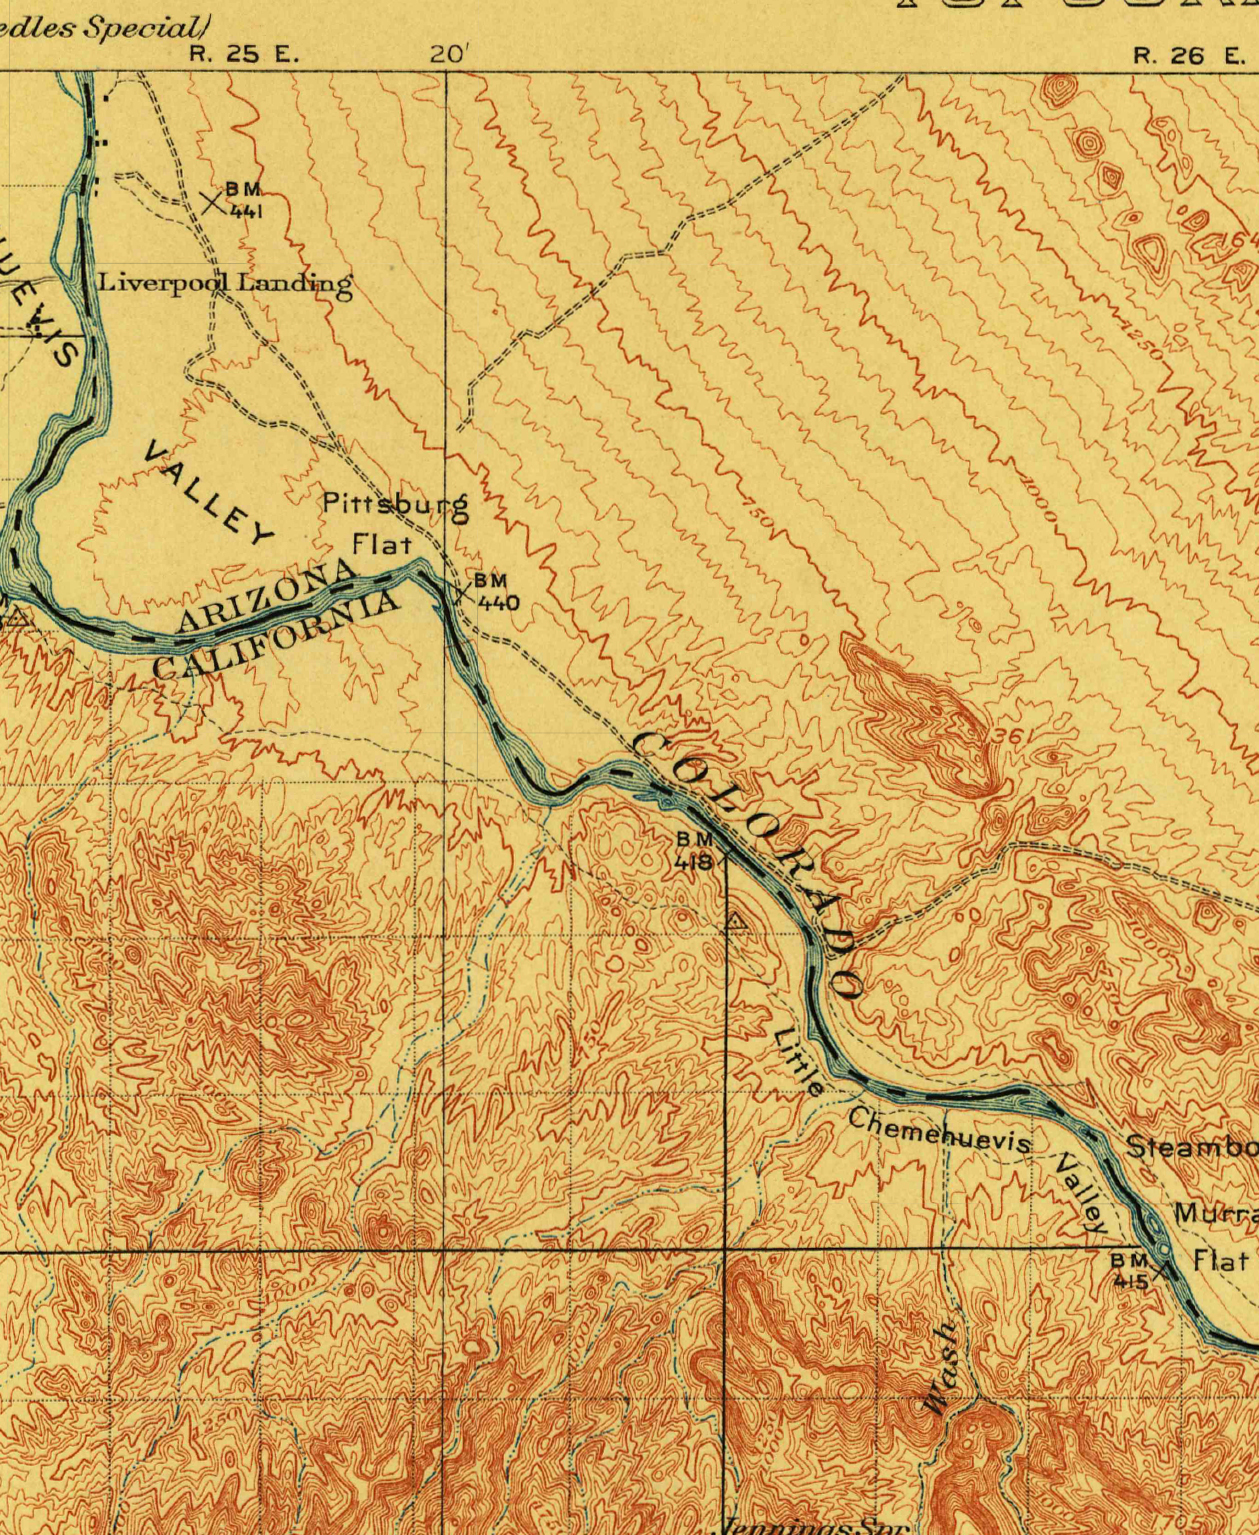
Parker Dam was constructed on the California-Arizona border on the lower Colorado River during the 1930s, as part of a project to employ people during the Great Depression, to generate electricity, and to provide water that could be pumped into aqueducts for agricultural, industrial, and residential use in other parts of Arizona.
The World Economic Forum has published a talk given by Illah Nourbakhsh, professor of robotics from Carnegie Mellon and Matthew Hansen, a remote sensing specialist at the University of Maryland, that demonstrates how visualizing big data can revolutionize the way we understand and imagine the world.
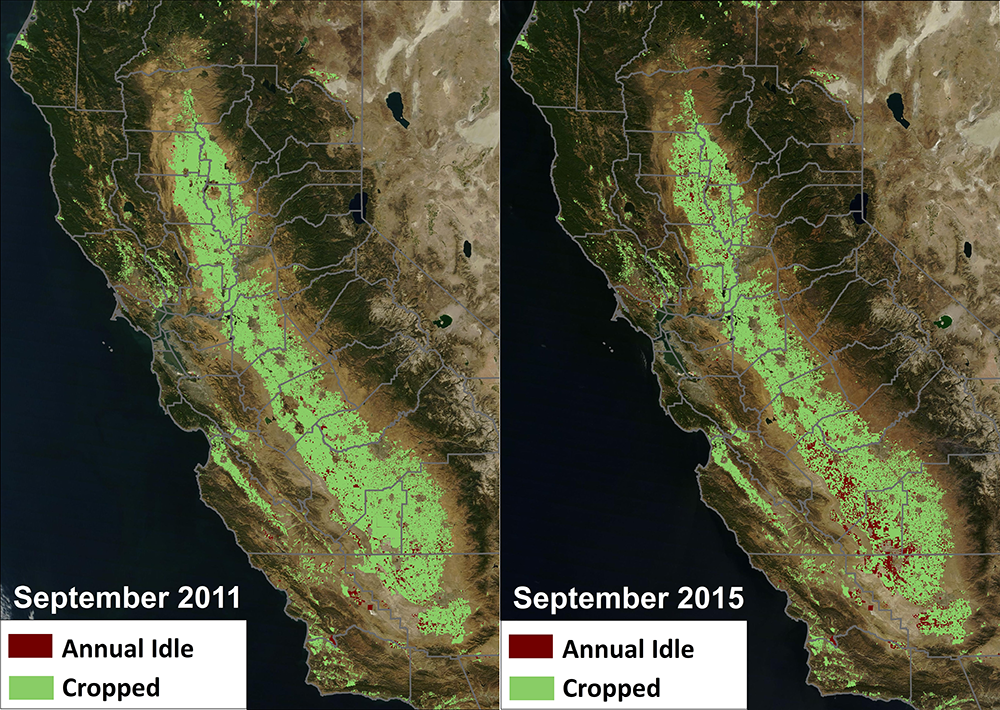
NASA, in collaboration with the United States Department of Agriculture (USDA), United States Geological Survey (USGS), and the California Department of Water Resources, released data today showing the effect the current drought has had on agricultural production and the idling of California farmlands.
The European Commission and the United States signed the “Copernicus Cooperation Arrangement” which will facilitate data sharing from the Copernicus constellation of Sentinel Earth Observation satellites among a broad spectrum of users on both sides of the Atlantic.
Imagine you’re flying 438 miles above the Earth taking pictures and collecting information of everything below. What do you see? Now imagine you’ve been doing this non-stop for over 40 years. Do you notice any change?
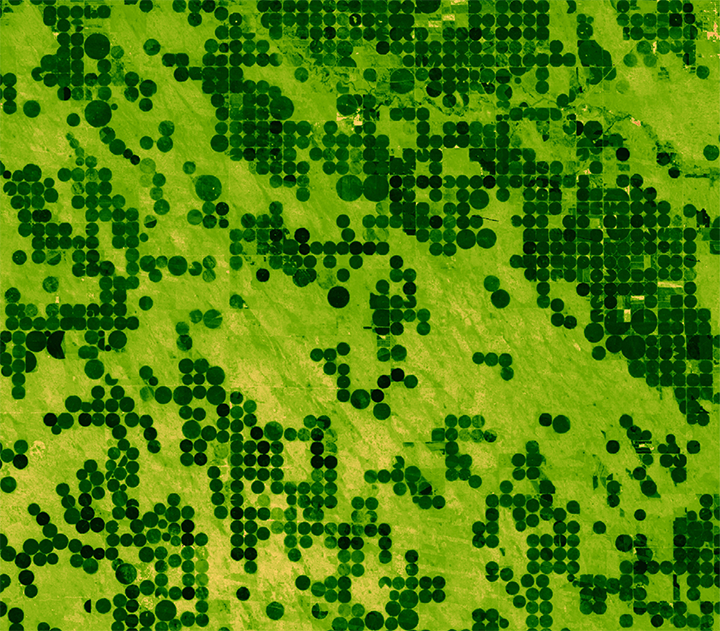
This fall scientists at the University of Nebraska, with partners at Google Inc., the University of Idaho and the Desert Research Institute, introduced the latest evolution of METRIC technology—an application called EEFLUX, which will allow anyone in the world to produce field-scale maps of water consumption.
Landsat enables coastal geomorphologists to observe changes to barrier islands on annual and decadal time scales—providing information about island size, shape and position, as well as erosion, land loss and island breakup.
The NASA Land-Cover/Land-Use Change (LCLUC) Program held its annual spring Science Team Meeting (STM) on April 22-23, 2015, in College Park, MD.
Using the world’s first global, Landsat-based 30-meter resolution map of tree cover, researchers found that ambiguity of the term “forest” has the potential to create 13 percent discrepancies in forest area maps. While ecologists have long understood the complexity comprised by the concept of “forest”, and while geographers have called for the term to be more uniformly defined across monitoring entities, no one had quantified the scope of the problem.
