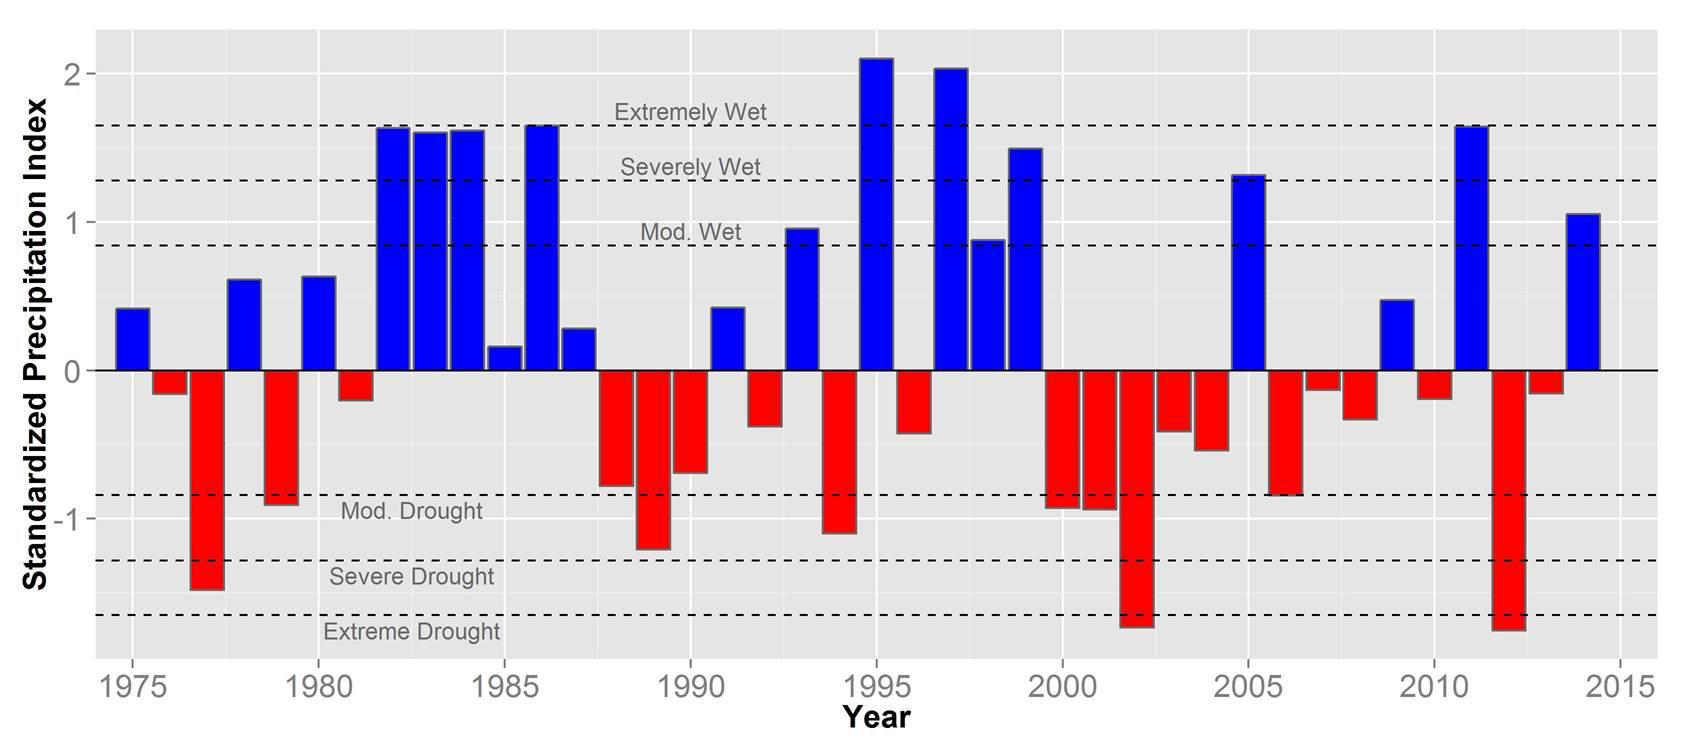

The study area experienced a relatively dry period since 2000, while 2002 and 2012 were both extreme drought years. However, little attention has been given to the effect of top down climatic controls on the condition of the forest across the region. Recent drought-related mortality of aspen has been documented in western North America (Michaelian et al., 2011; Worrall et al., 2008) and multiple studies have documented an increase in mortality rates of coniferous species throughout the western United States over the later part of the 20th century (van Mantgem et al., 2009). This prompted the question:
What are the spatial and temporal trends of recent drought in a forested ecosystem expected to be vulnerable to climate change?
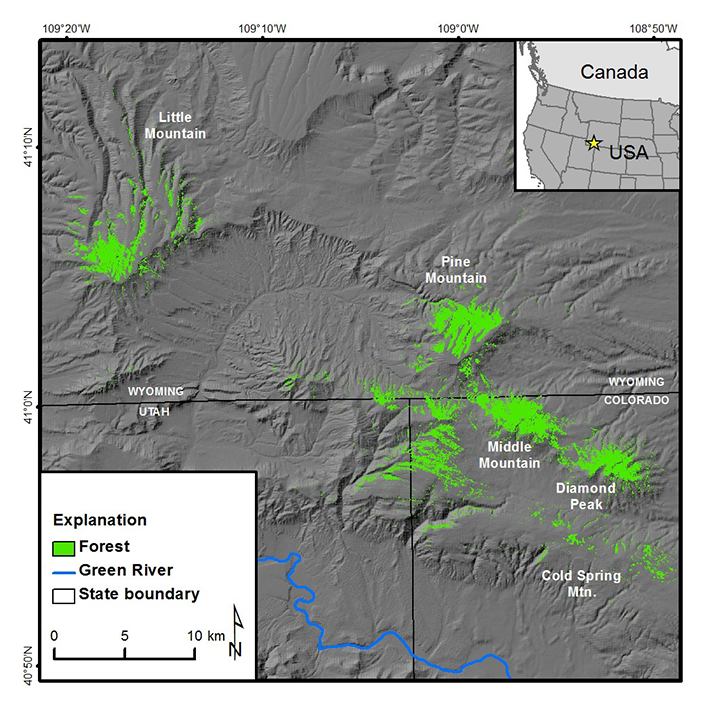
We had no baseline data or long-term plots in the area, so we turned to the remote sensing archive to determine if drought altered forest structure over the course of a decade-and-a-half. We analyzed 22 years of Landsat satellite data to determine changes in forest condition between 1985 and 2012. The driving concept of the analysis was to assess the relationship between recent satellite imagery and the condition of vegetation on the ground; then backcast the relationship over the last thirty years to determine when and where change occurred. We assessed the relationship between plant moisture (a proxy for plant productivity derived from satellite data) and a number of ground based measurements.
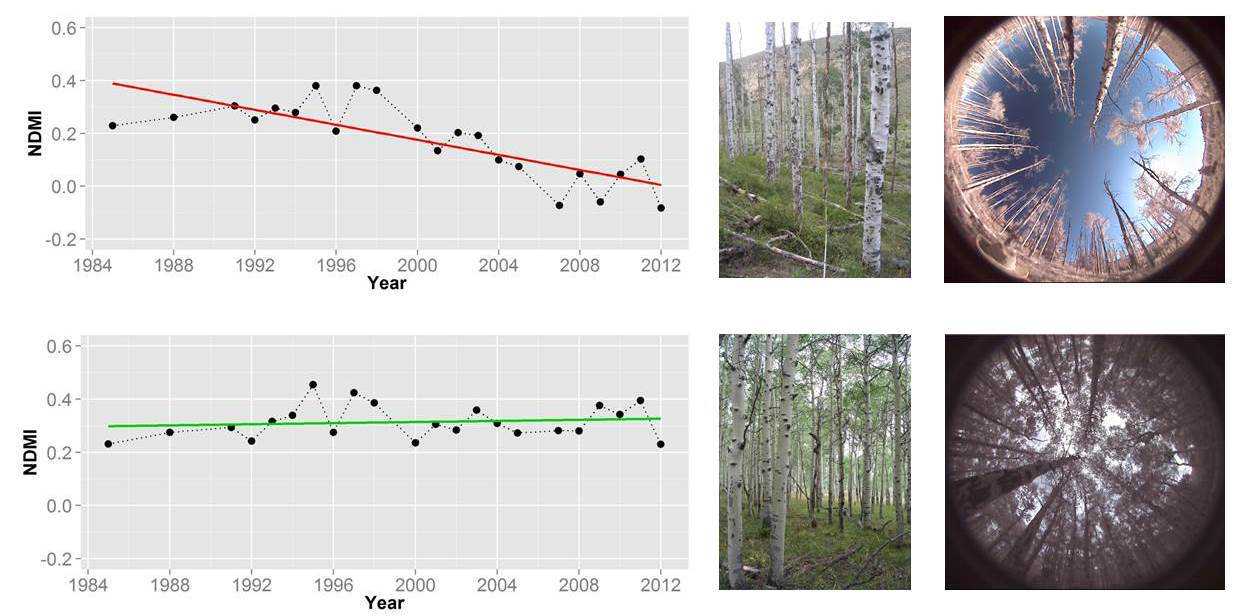
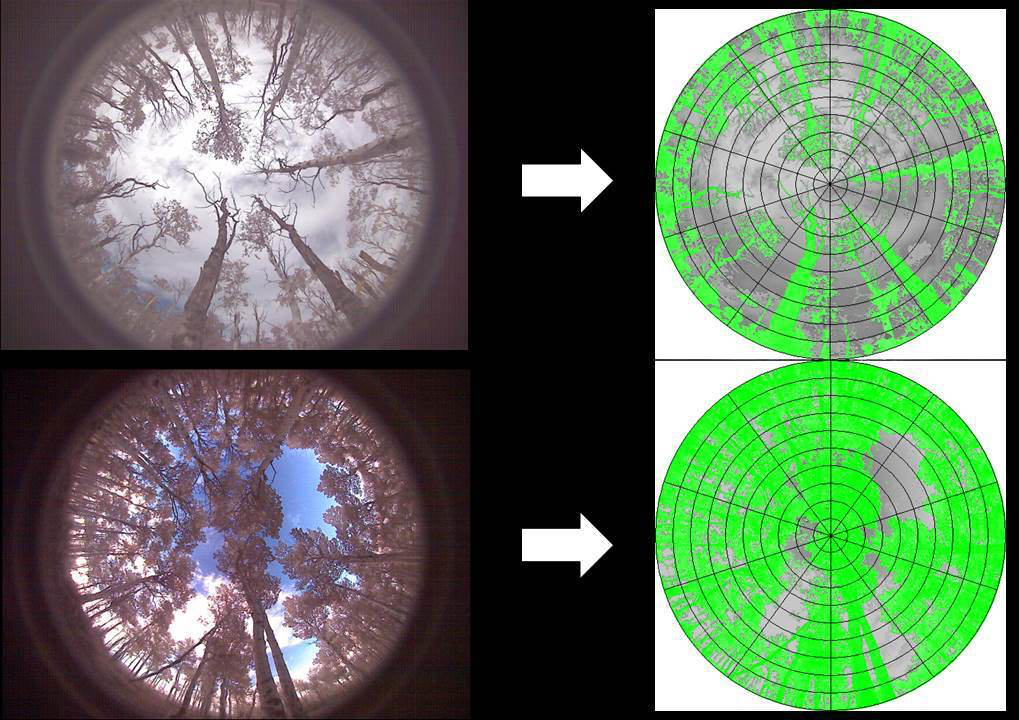
In one set of measurements we used hemispheric or fisheye photos to measure the amount of aboveground plant material in a plot. Our results indicate there is a strong linear relationship between the amount of plant material on the ground and plant moisture measured from a satellite.
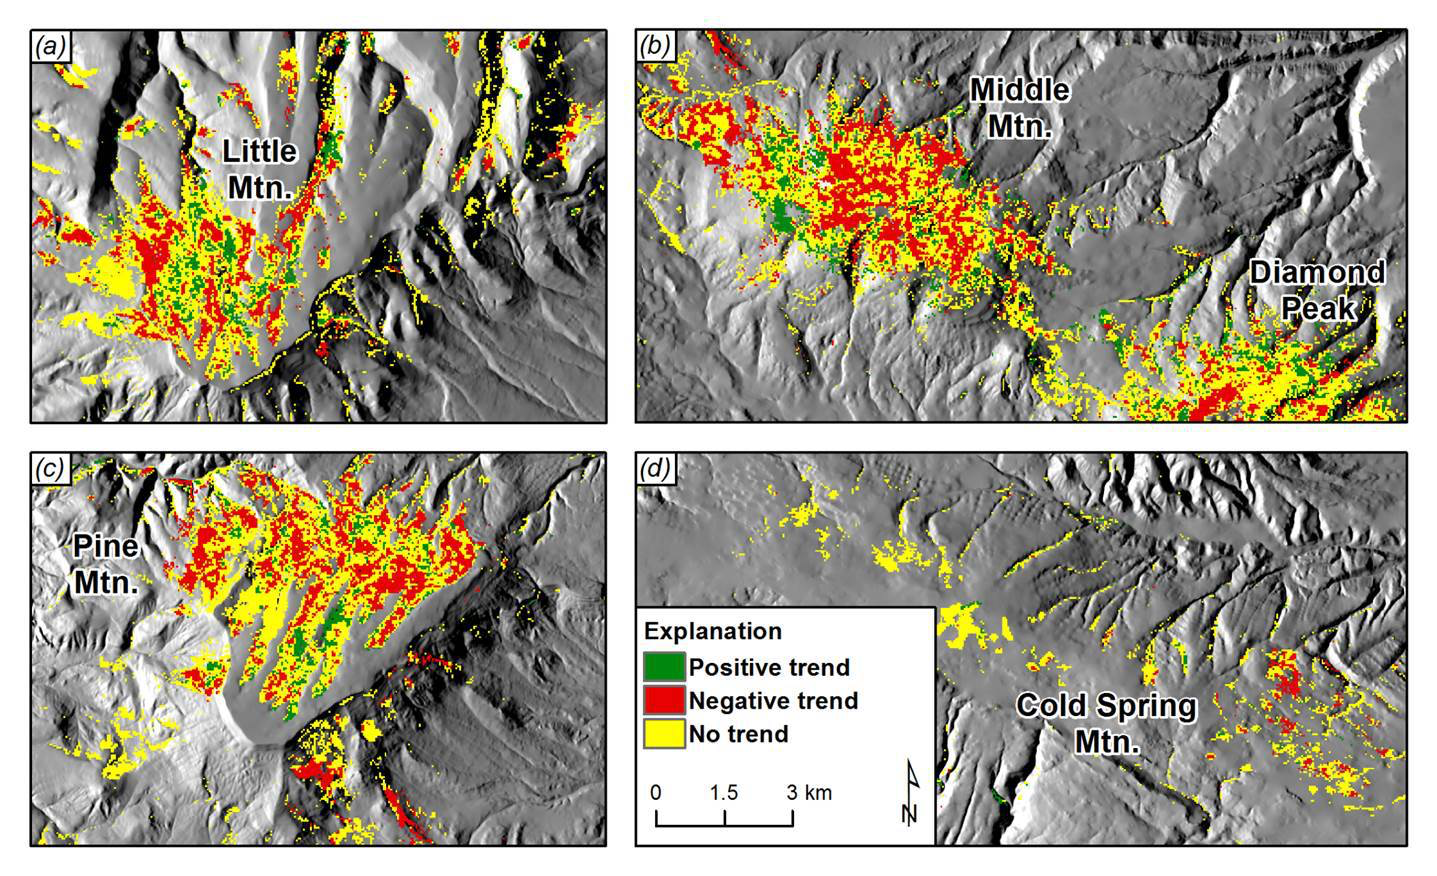
We hypothesized the long-term trajectory of plant moisture could be used to identify areas of forest that are resistant, persistent or vulnerable to severe drought. To do this, we ran simultaneous regression analyses for every 30 square meter Landsat pixel (upwards of 100,000 regressions) that incorporated plant moisture as the dependent variable and time as the explanatory variable. We then mapped the direction of the slope in each regression equation across the study area to identify trends in forest condition.
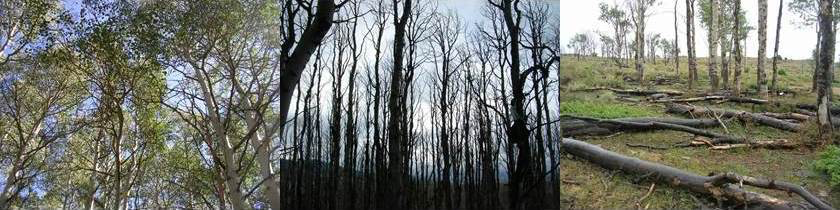
Field plots with a negative trend had a lower live tree density, and higher amounts of standing dead and down trees compared to plots with no trend. We can use this information to analyze individual forest stands and analyze the timing of changes in the plant moisture trajectory.
Assad et al.’s results identify areas of forest that are resistant, persistent or vulnerable to severe drought. The analysis gives natural resource managers a long-term perspective of the forest dynamics of this ecosystem and could inform treatment options or monitoring efforts. The spatial data generated from the analysis gives managers a glimpse into the recent past and it may hold clues as to how this system will respond to projected climate change. Their framework relies heavily on open access satellite data and could be applied to long-term monitoring of similar ecosystems.
Read the original post on Tim Assal’s blog.
References
+ Assal, T.J., Anderson, P.J., Sibold, J., 2016. Spatial and Temporal Trends of Drought Effects in a Heterogeneous Semi-Arid Forest Ecosystem. Forest Ecology and Management. 365, 137-151.
+ Assal, T.J., Anderson, P., Sibold, J., 2015. Mapping forest functional type in a forest-shrubland ecotone using SPOT imagery and predictive habitat distribution modelling. Remote Sensing Letters. 6, 755–764.
+ Michaelian, M., Hogg, E.H., Hall, R.J., Arsenault, E., 2011. Massive mortality of aspen following severe drought along the southern edge of the Canadian boreal forest. Global. Change Biology. 17, 2084–2094.
+ Van Mantgem, P.J., Stephenson, N.L., Byrne, J.C., Daniels, L.D., Franklin, J.F., Fulé, P.Z., Harmon, M.E., Larson, A.J., Smith, J.M., Taylor, A.H., Veblen, T.T., 2009. Widespread increase of tree mortality rates in the western United States. Science 323 (80), 521–524.
+ Worrall, J.J., Egeland, L., Eager, T., Mask, R.A., Johnson, E.W., Kemp, P.A., Shepperd, W. D., 2008. Rapid mortality of Populus tremuloides in southwestern Colorado, USA. Forest Ecology and Management. 255, 686–696.