Landsat satellites are helping to answer that question.
Water Use Mapping
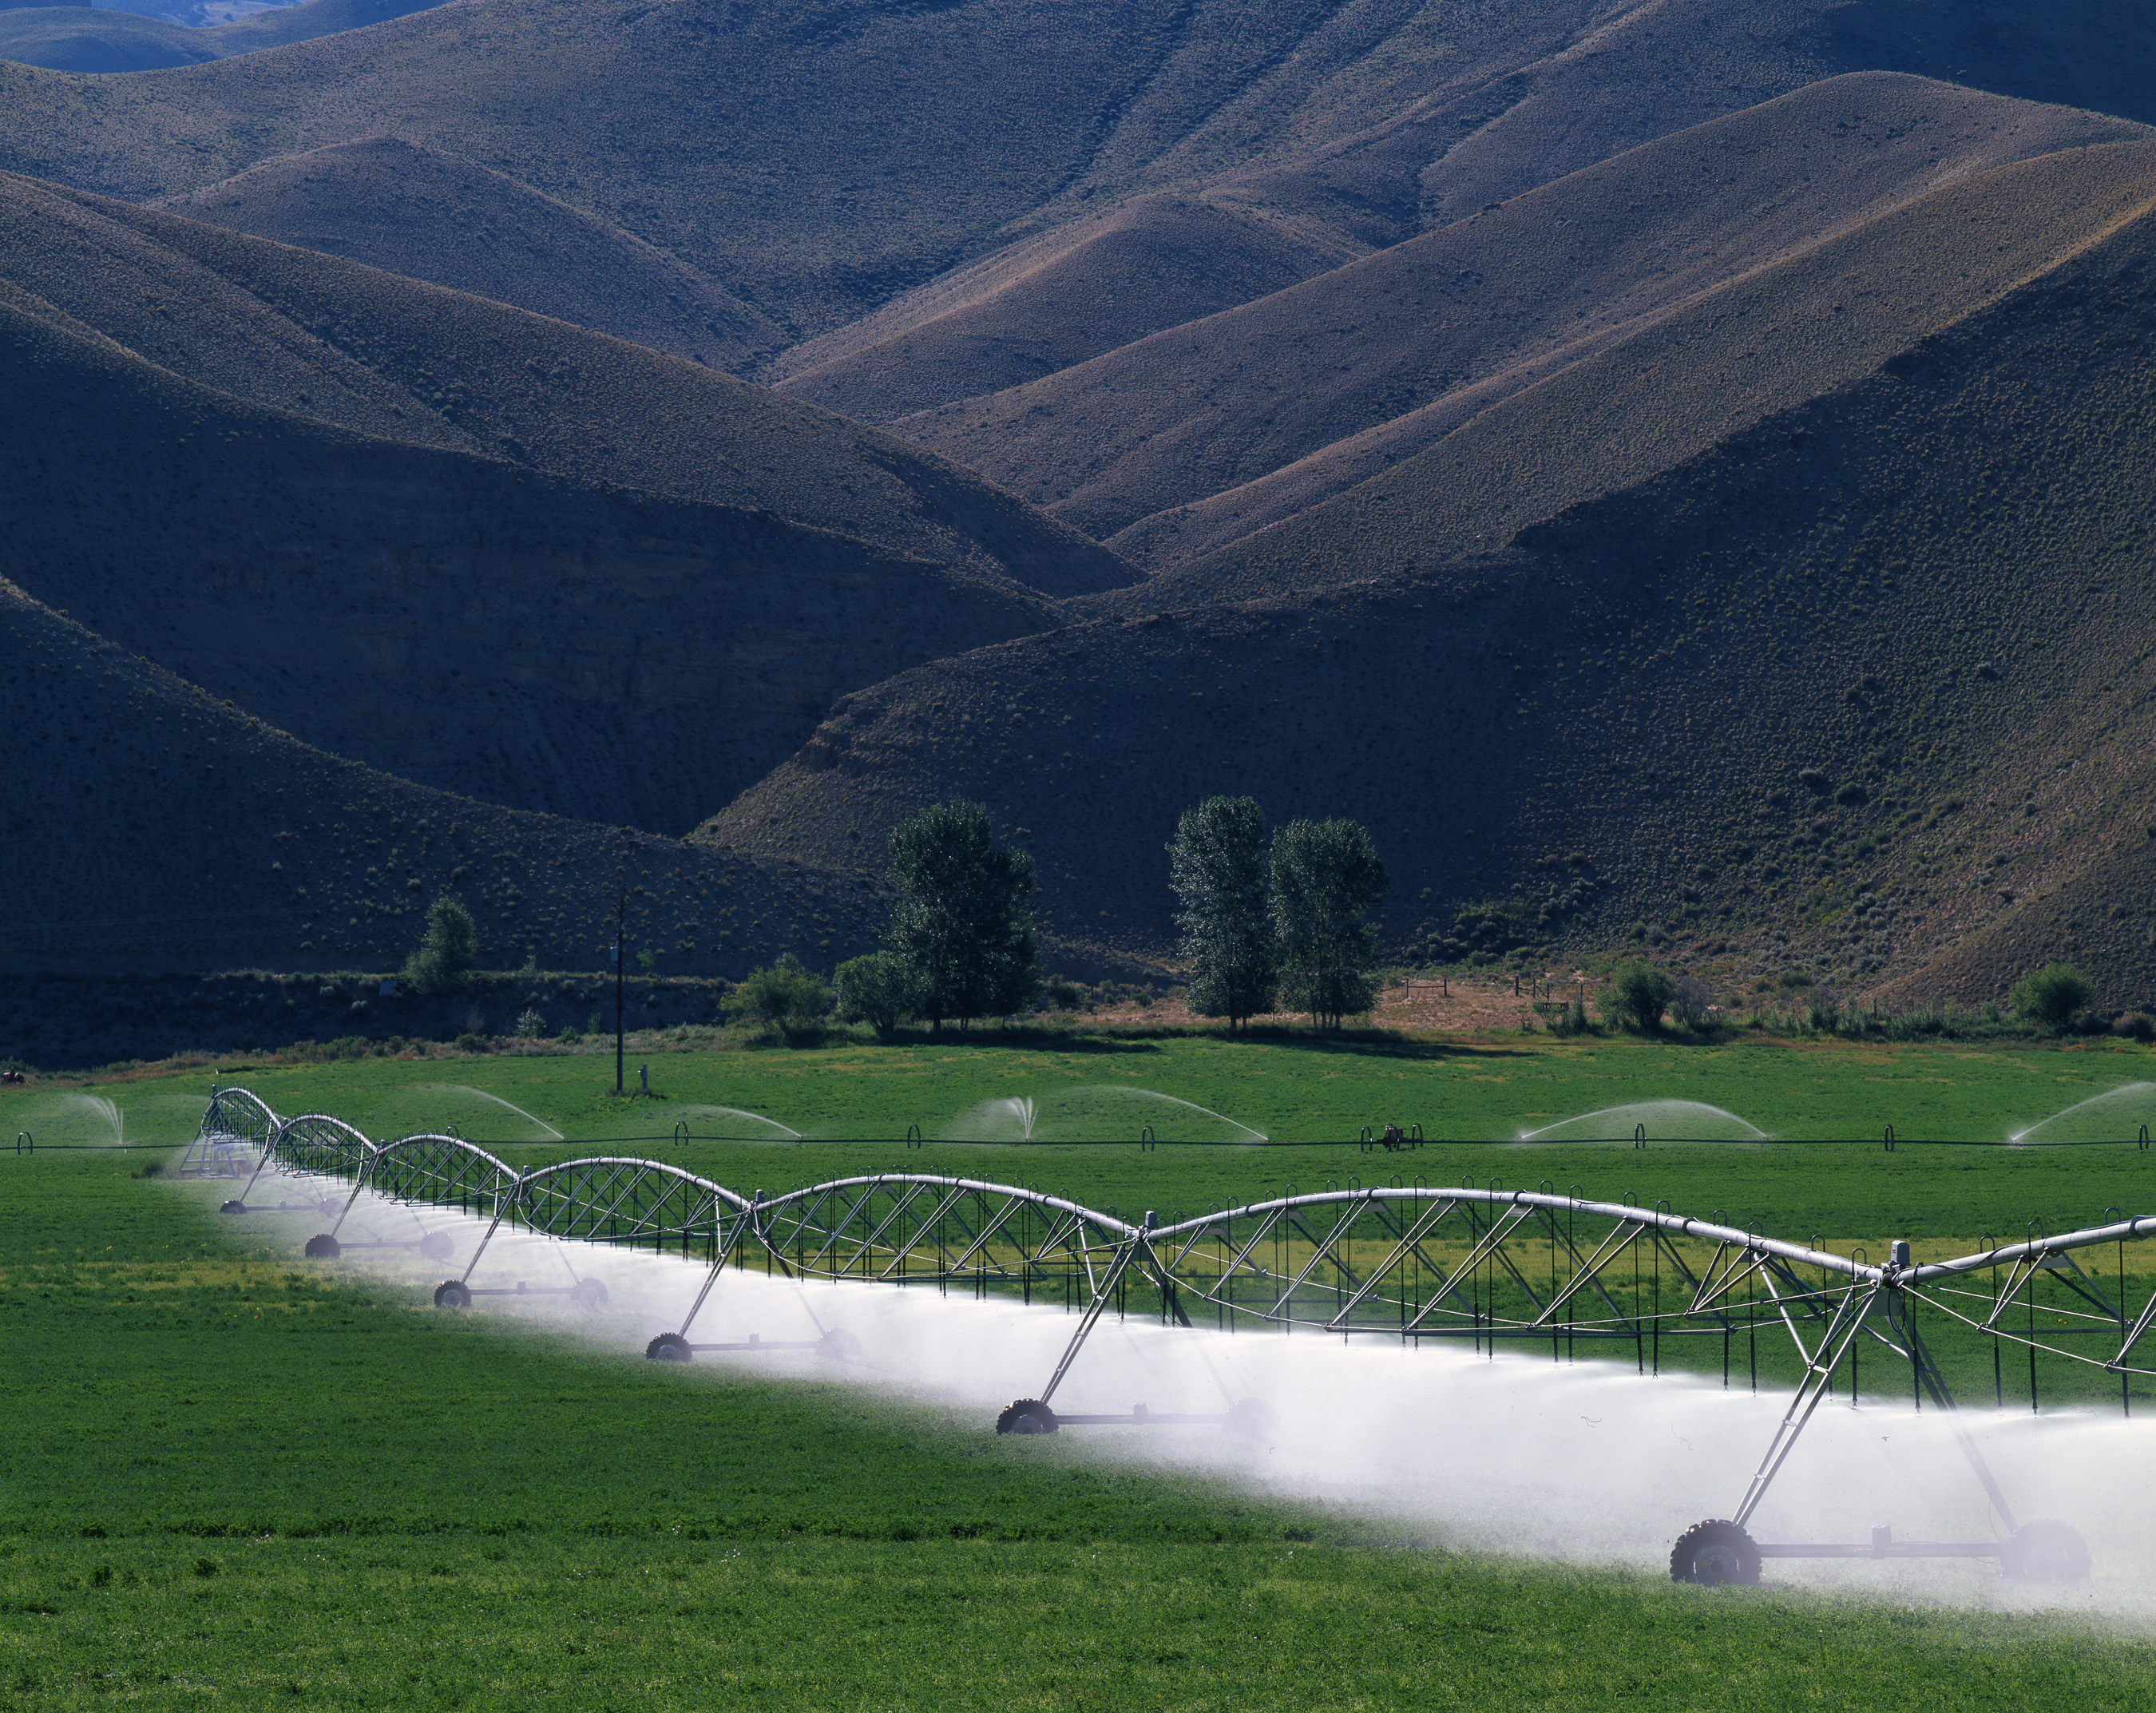
Using Landsat satellite data, scientists with the U.S. Geological Survey (USGS) have helped to refine a technique called evapotranspiration (ET) water-use mapping to measure how much water crops are using across landscapes and through time. These ET water-use maps are created using a computer model that integrates Landsat and weather data.
Crucial to the process is Landsat’s thermal (infrared) band. Thanks to that thermal band with its 100-meter resolution, water-use maps can be created at a scale detailed enough to show how much water crops are using at the level of individual fields anywhere in the country.
From Daily Glimpses to Long-term Trends
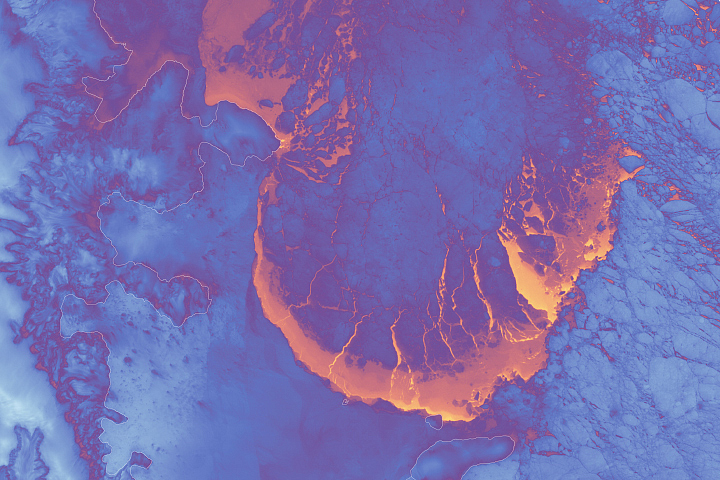
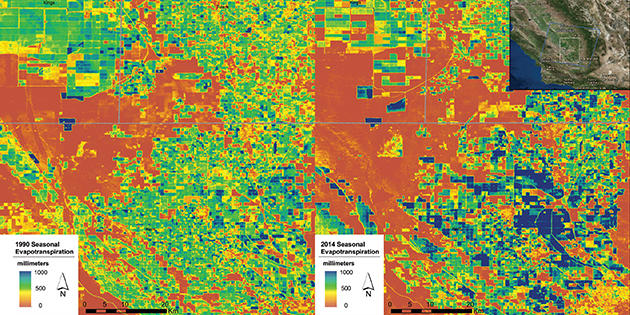
ET water-use maps can show how much water crops are using in a single day or during an entire growing season. Drawing on the vast Landsat satellite image archive, it’s also possible to create maps that span decades to reveal long-term trends in water use (top). That Landsat archive—invaluable to water-use mapping and so much more—might never have become a reality without the visionary support given to Earth observation from space by Interior Secretary Stewart Udall during the 1960s.
How Water-Use Maps Help
Where is water being used, how much, and by whom?
Which types of crops are using the most, or least, water?
Can water be used more efficiently without impacting crop yields?
Basin-scale water-use maps assist in understanding water balance and availability in river basins and watersheds. These large-area maps are useful for:
Estimating water use by different sectors within a watershed.
Resolving disputes regarding water rights and allocations.
Evaluating aquifer depletions and quantifying net ground water pumping.
Planning Today for Water Tomorrow
According to a recent Government Accountability Office report, 40 of 50 state water managers expect water shortages in their states between now and 2023. Addressing concerns about America’s water resources begins with a clearer understanding of water availability and water-use trends. Mapping water use based on Landsat satellite data has demonstrated immense potential at local and regional scales, and will soon become the basis for monitoring and assessing water use across the nation.
Learn More
Celebrating A Vision to Observe Earth: 50th Anniversary
Landsat: Continuing to Improve Everyday Life