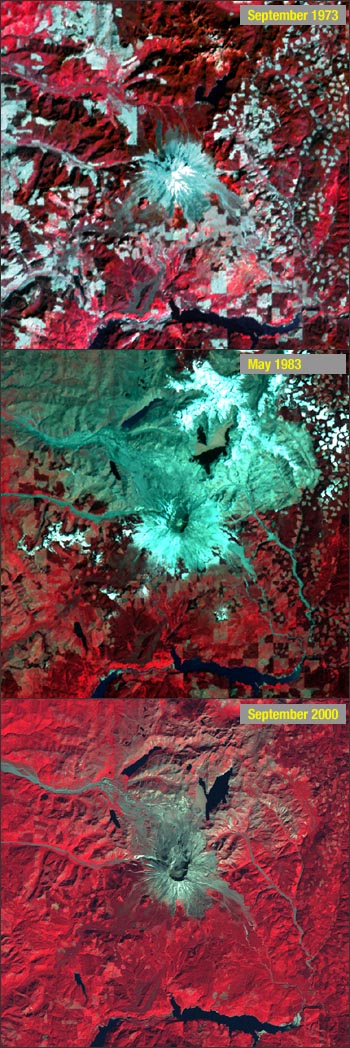
Location: Mt. St. Helens, Washington

These satellite images show the area around Mount St. Helens, in southwestern Washington, before and after its eruption of May 18, 1980. The initial volcanic blast devastated more than 150 square miles of forest within a few minutes and 60 people were dead or missing.
In the following nine hours, volcanic ash rose more than 15 miles into the air, later to land in troublesome amounts as far away as Montana.
Before the eruption, Mount St. Helens towered about a mile above its base, but during the eruption, its top slid away in an avalanche of rock and other debris. When finally measured about six weeks later, the mountain’s height had been reduced by 1,313 feet.
In these images, ash, mudslides, and mud-laden rivers show as greyish blue. Water looks black. Ice and snow are white and vegetation is red. Several changes can be seen in these images:
The 2000 image shows gradual vegetation regrowth, as light red and pink, in the devastated area. Patchwork block patterns, where forest has been cut, are visible east of Mount St. Helens.
Spectral Characterization
The measured wavelength locations of the ETM+ spectral bands are compared to Landat 5’s TM in Table 8.1 The spectral bandwidths are determined by the combined response of all optical

