Landsat satellites are special in many ways. They record the entire global land surface every season, every year– and they have been doing it since 1972. They tell the story of how our landscapes have been changing for over 40 years! The Landsat 5 satellite even made it to the Guinness Book of World Records for having the longest life of any satellite in history: almost 29 years. The engineers and scientists overcame dozens of difficult technical challenges to keep this valuable satellite flying and delivering data. “The efforts of the Landsat team were heroic,” said Jim Irons, project scientist for Landsat 8.
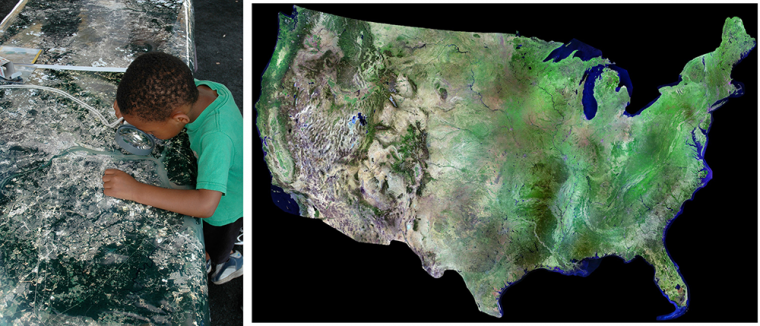
Landsat provides images of Earth at a resolution of 30 m, about the size of a baseball infield. People are too small to appear in a Landsat scene, but neighborhoods can be seen. Larger streets and schools, shopping centers, and most open spaces are visible, as are glaciers and volcanic eruptions.
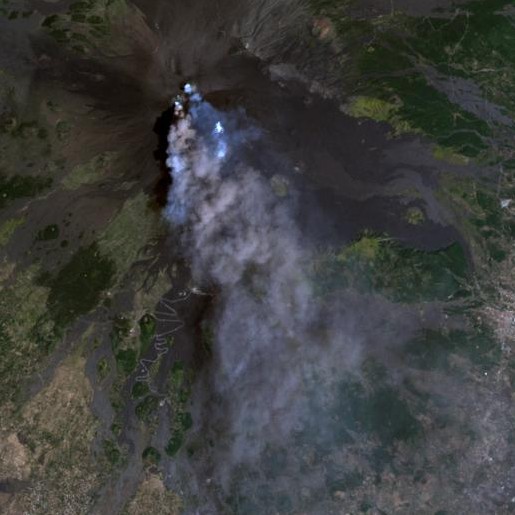
Landsat satellites measure the same colors of light that your eyes see, which are combined shades of red, green, and blue light. Satellite images made with red, green, and blue show the Earth as you would see it if you were in space. Below is an example of how you might see the volcano Mount Etna erupting in 2001, using Landsat’s visible wavelengths. You can see lots of smoke and ash billowing from the volcano.
Volcanoes: Where’s the Heat?
But Landsat lets us see more than smoke and ash clouds. We can also see heat being reflected from the hot volcanic surface, using infrared light that our eyes alone cannot detect. Software for Landsat data analysis helps us to translate data on the infrared light into images we can see. Below is the same scene as the one above, but this version of the scene uses a combination of some visible green light and some infrared light. What can you see, now that infrared light has been added?
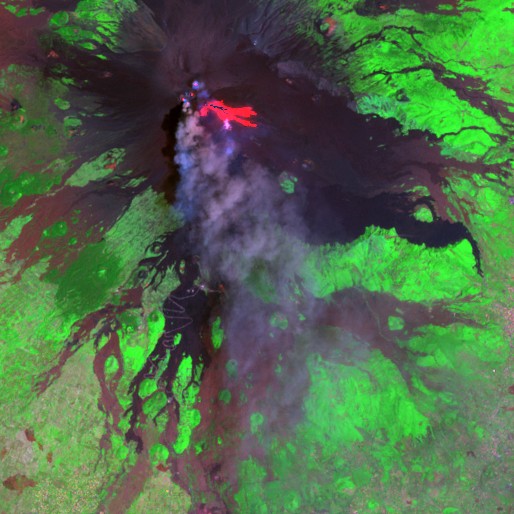
The scene with infrared light is showing us where the hot lava is pouring from the volcano. If you were at the volcano and wanted to run from the lava, which way would you turn?
The wavelength ranges used by Landsat 8 (launched in February 2013) are these: deep blue, blue, green, red, four near and shortwave infrared bands, a panchromatic (grayscale) band, and two thermal Infrared bands.
Farming for Sugar Beets
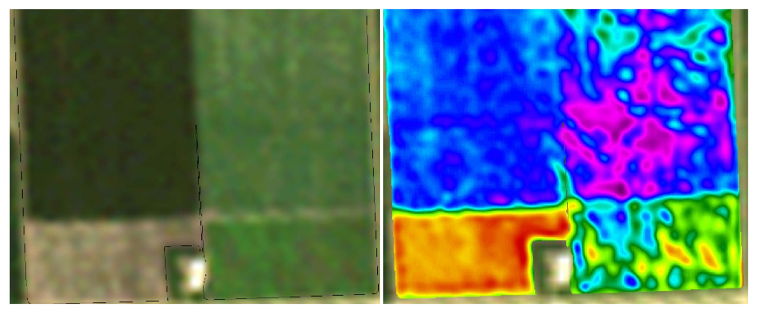
Farmers can use Landsat’s capabilities for combining visible and infrared light. The image at left uses visible light to show a field where beets are grown (owned by a fellow called Gary). The fields appear green because of the green beet plants growing there. (Some bare ground also appears.) The image at right shows the same field at the same time, but it uses a combination of visible and infrared light. Having lots of nitrogen makes beets sweeter. Landsat can measure reflected infrared light to “see” where beets are absorbing the most nitrogen. Within a visibly green field (figure on left), the infrared light can show areas where plants absorbed different amounts of nitrogen. Areas where more nitrogen was absorbed are magenta and blue (figure on right), and areas that absorbed less appear green and yellow. Where should Gary go to find the sweetest beets in this field? (If you say, middle right-hand side of his field, you’d be correct.)
Tracking Recovery from Forest Fire

Yellowstone National Park was burning in August 1988, at left. The heat signals of areas that are burning or have just burned were captured by the infrared sensitivity of Landsat and appear here in reds. (Some of the hot areas are obscured by bluish smoke.) By late September 2011, 23 years later, pinkish areas show recovery from fire. Some of the burned area is covered once again by trees and vegetation. Satellites like Landsat can provide the big picture of ecosystem recovery.
Taking Care of Our Water
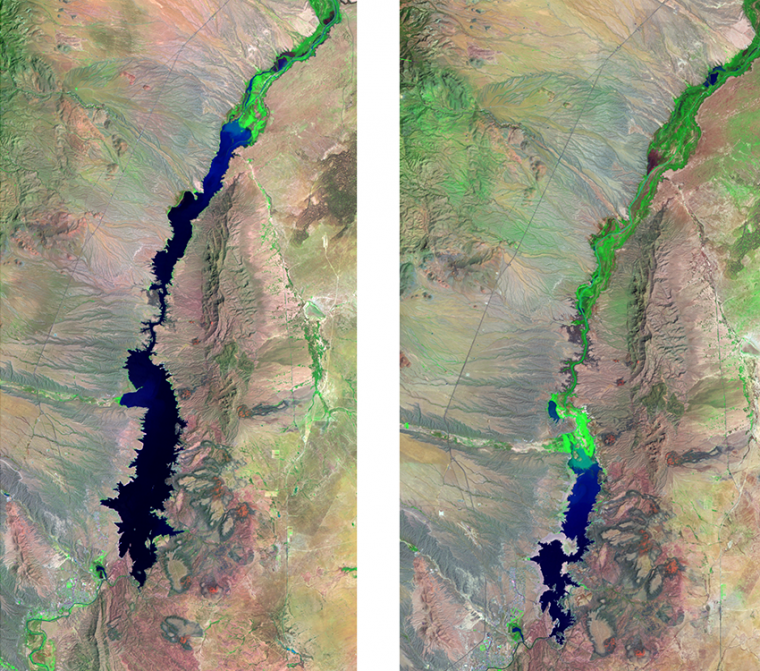
People who manage our water for drinking and farming also prize Landsat’s capabilities for combining visible light and infrared light. Consider how we can see water levels in Elephant Butte Reservoir, New Mexico with Landsat, as they have changed from August 1991 (at left) to 2013 (at right). In this visible-infrared light combination, blue and dark blue areas indicate water and bright green areas indicate vegetation that has replaced open water. Tones of pink and beige indicate little or no vegetation. Does this change from 1991 to 2013 look dramatic to you? It does to the people who depend on this water for consumption, recreation and energy production! The water level in the reservoir in summer 2013 was the lowest it had been for 40 years.
Keeping an Eye on a Retreating Glacier
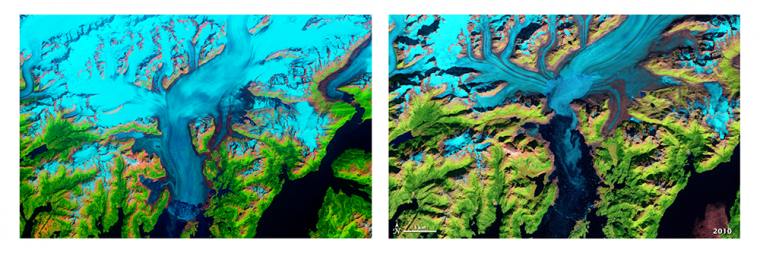
Landsat images combining visible and infrared wavelengths of the Columbia Glacier in Alaska show a rapidly thinning glacier whose terminus has dramatically retreated from 1986 to 2010. With this combination of wavelengths, snow and ice appear bright cyan and the open ocean is dark blue. Vegetation is green, exposed rock is brown, and rocky debris on the glacier’s surface is gray. By the differences in cyan and dark blue, one can see that where the ice stopped in 1986 is far south of where it stopped during the same season in 2010. Ice moving from land to oceans and warming ocean water are important contributors to global sea-level rise.
Making images with Landsat that combine visible and infrared wavelengths helps us to see and map our planet’s lands in new ways. S. S. Hall, author of Landsat Maps and the Remote-Sensing Revolution, put it this way, “… Landsat revealed whole new worlds hidden within the folds of a familiar world we thought we knew so well.” Landsat 8 is doing extremely well in its orbit above the Earth, sending us more than 400 scenes every day. We have a lot of mapping to look forward to!
Source: Jeannie Allen, senior technical specialist with Sigma Space Corp. at the NASA Goddard Space Flight Center, for Earth Science Week 2013: Mapping Our World
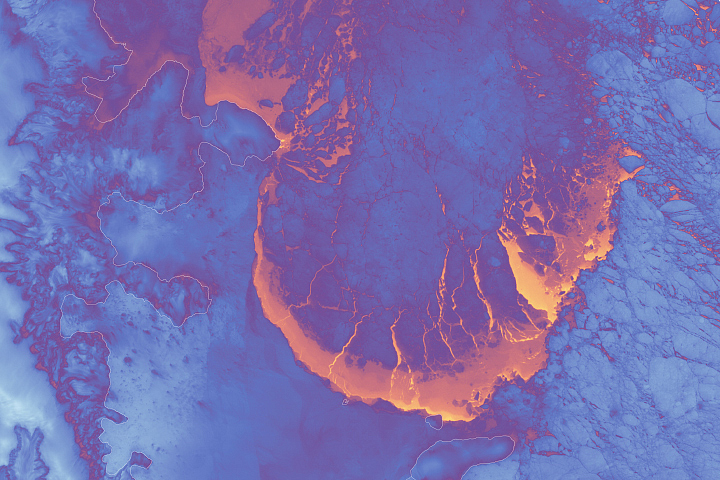
Scenes from the Polar Night
Landsat satellites have begun regularly acquiring images of ice at the poles during the winter, with enlightening results.