Maps often help us manage our world. In 1797, when cartographic engraver and chart publisher William Heatheri released his New Chart of the Mediterranean Sea, he had the needs of sea merchants foremost in mind.
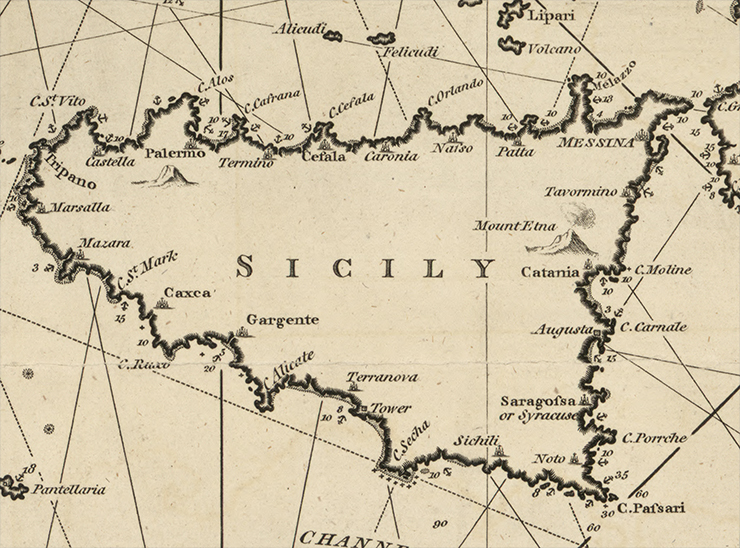
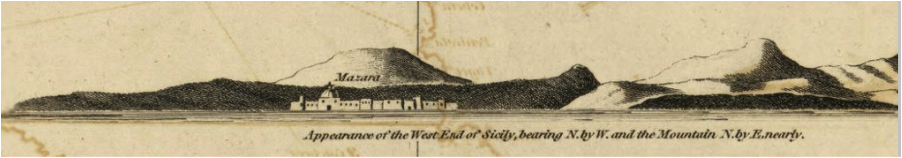
Information essential to seafarers abounds on his chart, as evidenced by the excerpt of the Sicily shown here. Rhumb linesii, or courses of navigation along a given compass bearing, crisscross the surrounding waters. When viewing this chart in its entirety eleven compass roses from which the rhumb lines originate can be seen. Additionally, depth soundings are given along the shorelines, safe anchorages are noted, and nautical hazards are shown—such as submerged rocks denoted with small “x” symbols. While the interior of Sicily contains little information but the island’s name, all of the port towns are shown along with large landmarks like Mount Etna with its pluming volcano. Heather’s chart also features seven views of the shore as seen from the sea, including the western coast of Sicily with the town of Mazara.
This chart told sea merchants how to get to a given port, where to anchor once there, and what hazards they should be aware of during their journey. The copy of this chart held by the Library of Congress was originally printed on three sheets of vellum which were later quartered and mounted on cloth for easier folding—perhaps to be stowed in some captain’s quarters.
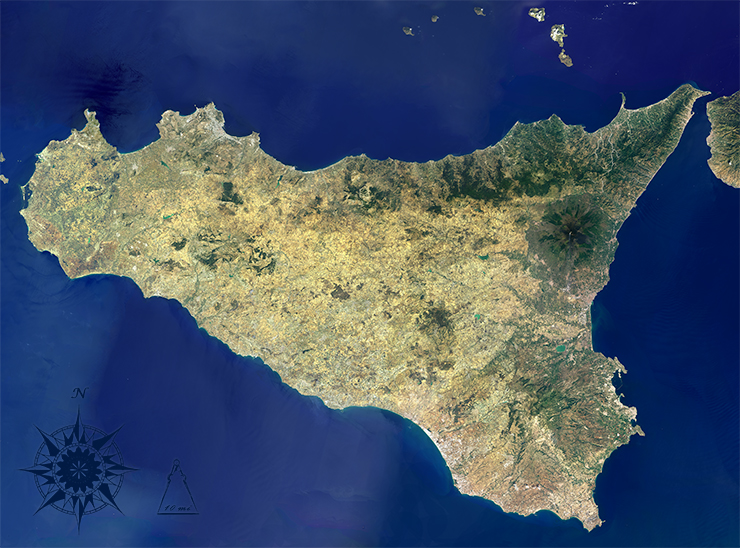
When comparing Heather’s chart to the Landsat 8 image of Sicily (acquired 2013, and made using OLI bands 4,3,2), we can see that on Heather’s chart, Sicily is somewhat misshapen and points of land are often exaggerated. Interestingly, the Straight of Messina where easternmost Sicily nears Calabria in mainland Italy, is portrayed more simply in the chart than it is in reality. As seen in the Landsat image, a thin peninsula juts out from Sicily creating a narrow channel barely two miles wide between the island and mainland. Here, where the Ionian and Tyrrhenian Seas connect, intensive tidal dynamics are created and natural whirlpools form. It is surmised that this is the location Homer refers to when narrating the story of Odysseus’ journey between Scylla and Charybdis.iii
The Landsat image tells us more about the natural environment of Sicily. We can see the green vegetation that appears flanking Mt. Etna’s upper reaches and the volcano’s south-trailing emission plume as well as land use patterns (green forestlands, gold agricultural lands, and grey-white urban areas). Offshore, we can see sediment patterns in the coastal waters and some wave patterns. Were we to look at a series of these Landsat images over time we could map environmental changes.
References:
iAntique Maps Online, http://www.antique-maps-online.co.uk/william-heather.html, Accessed 21 Nov. 2013
iiJames Alexander, “Loxodromes: A Rhumb Way to Go,” Mathematics Magazine, vol. 77, no. 5, December 2004.
iiiS.A. Androsov, N.Ye. Vol’twinger, and B.A. Kagan, “The Messina whirls in the present and past,” Atmospheric and Ocean Physics, vol. 31, no. 5, April 1996
Images created using Landsat 8 OLI bands 4,3,2 The images were collected between July and August of 2013. Images by Mike Taylor using Landsat data available from the USGS archive. Caption by Laura Rocchio.