Contributor: Melissa Quijada, NASA Goddard Space Flight Center
NASA satellite images regularly map active fires around the world. Once a fire is out, satellite data and maps are also used by scientists to measure and protect the scorched land, and have played an important role in streamlining fire recovery efforts.
The Remote Sensing Applications Center (RSAC), operated by the U.S. Department of Agriculture Forest Service, and other national agencies that specialize in fire recovery use Landsat 5 and 7 satellite data to observe vegetation, water and soil changes after a fire. These observations are then used by fire response teams to protect houses and other buildings near the fire site, in addition to wildlife and bodies of water.
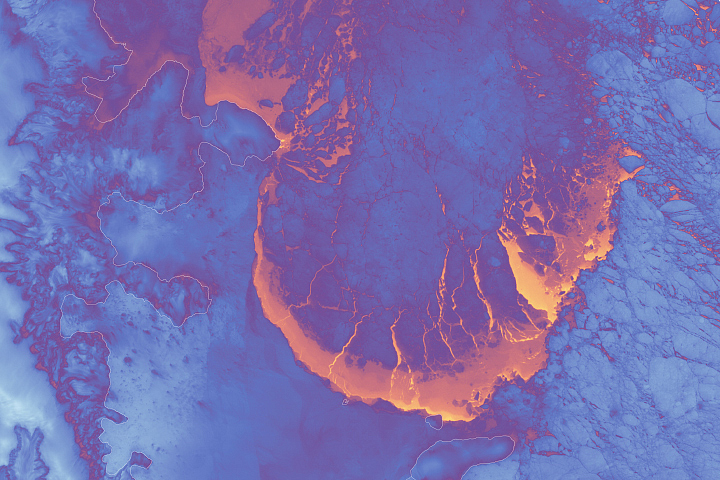
This summer RSAC’s data visualization team used Landsat satellite data to create a map of the Wallow North Fire in Arizona, depicting ecologic changes due to high temperatures. The Wallow fire raged from April to July, 2011 in southeastern Arizona.
The Landsat Program is a series of Earth-observing satellite missions jointly managed by NASA and the U.S. Geological Survey (USGS). Since 1972, Landsat satellites have consistently collected critical information about Earth from space.
Landsat 5 and 7 satellites collect large amounts of image data while in orbit; each satellite orbits the Earth approximately 15 times per day and the orbits bring the entire Earth within view of the sensor on each satellite once every 16 days. Landsat quantifies visible, infrared, and thermal energy that is reflected or emitted from the Earth’s surface. From these data specialists produce color-coded maps that depict and characterize land cover, land use, and land surface change over time.
The satellite data, for instance, can tell scientists and land managers how fire transforms the land surface as well as enable them to measure how this transformation alters the ecosystem. For example, burned soils resist rainwater infiltration, leading to increased runoff, erosion, land slides and flooding. Satellite data help indentify, locate and map those burned areas most susceptible to the increased runoff and erosion. Fire response teams then treat burned sites with a variety of measures to minimize erosion, such as spreading ryegrass seeds to stabilize the soil, and placing straw mulch on hill slopes for ground cover to intercept rainfall before it hits the burned soil.
The response depends on the intensity of a fire; some burned areas require more immediate and intensive response efforts than others.

Near the end of a fire’s life, an interagency Burned Area Emergency Response (BAER) team, including geographic information systems (GIS) specialists, wildlife biologists and hydrologists, assess the condition of the land. Within a week of this assessment the team creates a prescription plan used by local fire response teams to protect the public and residences. A critical part of this assessment includes mapping soil burn severity, which the BAER team generates using Landsat-derived maps provided by the RSAC.
To create the initial burn map used by the BAER team, the RSAC first generates Normalized Burned Ratio (NBR) maps from Landsat’s near infrared and shortwave infrared data acquired before and after the fire. Next the RSAC creates a differenced NBR (dNBR) image by subtracting the post-fire NBR data from the pre-fire NBR data. The resulting map delineates the burned area and corresponding ecosystem changes. BAER teams use the RSAC’s burn map to generate a soil burn severity map that is used to assess and identify potential hazards and risk, which often follow fires.
“Before we started using Landsat data to assess post-fire conditions, BAER teams had to conduct aerial and ground-based surveys, sit down with a topographic map and sketch out areas of high burn severity,” said Brad Quayle, remote sensing/GIS specialist at RSAC, Salt Lake City, Utah. “With our USGS partners, we’ve now mapped over 28 million acres and 900 fires since 2001 using Landsat satellite data.”
Algorithms like NBR are based on raw Landsat data. NASA and USGS pride themselves on high quality data, which the scientific community uses as a gold standard for other satellite data.
“The Landsat measurements are consistently highly accurate, pixel-to-pixel, image-to-image. That’s why you can make these types of maps,” said Anita Davis, outreach and education coordinator for the Landsat mission at NASA Goddard Space Flight Center, Greenbelt, Md.
A host of other national agencies use Landsat data to develop their own maps and ecological assessments. RSAC in conjunction with the U. S. Geological Survey for example, run Monitoring Trends in Burn Severity (MTBS), a multi-year project designed to map the burn severity and perimeters of fires in the U.S. from 1984 to 2010.
The Emergency Stabilization and Rehabilitation program of the U.S. Department of the Interior’s Bureau of Land Management also develops treatment plans for post-fire landscapes. Another interagency vegetation, fire and fuel-mapping program, called LANDFIRE (Landscape Fire and Resource Management Planning Tools) uses Landsat data to measure the nation’s changing landscape for climate change and ecological research.
Two other NASA satellites called Terra and Aqua carry Moderate Resolution Imaging Spectroradiometer (MODIS) instruments that observe almost the entire globe daily at a coarser spatial resolution. MODIS images assist fire management agencies to locate and monitor active fires because the MODIS data are available more frequently and in real time. Landsat data, in contrast, are collected less frequently but with a higher spatial resolution better suited for planning post-fire recovery efforts.
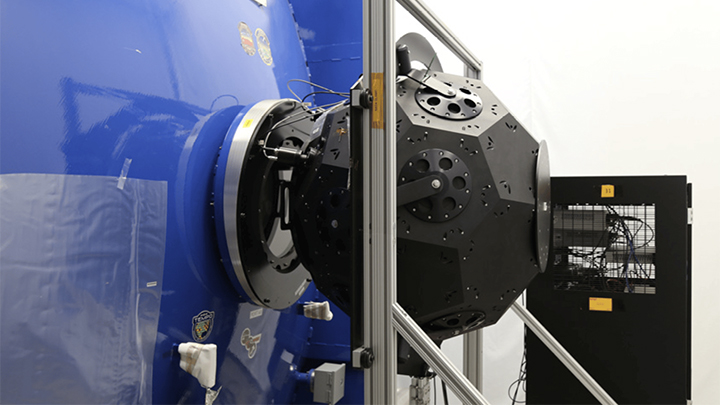
The existing Landsat satellites are operating well beyond their design life. To maintain this critically important source of data, NASA and the U.S. Department of Interior’s USGS are working to launch the next Landsat satellite, called the Landsat Data Continuity Mission (LDCM), in December 2012. LDCM will capture more spectral bands of light than previous Landsats, with new radiometer technology.
“The new sensors on this mission will improve performance relative to the sensors flown on previous Landsat satellites,” said James Irons, LDCM project scientist under contract to NASA, LDCM’s Operational Land Imager is being built by Ball Aerospace Technology, Inc; NASA’s Goddard Space Flight Center is building the Thermal Infrared Sensor. Both instruments will ride aboard the spacecraft NASA has contracted from Orbital Sciences Corporation.
After launch and on-orbit checkout, USGS will operate the satellite, and continue to collect, provide and archive Landsat data. The entire Landsat archive, dating from 1972 to present, will continue to be freely available to everyone, everywhere.
Further Information:
+ NASA Website: “Landsat Image Maps Aid Fire Recovery Efforts”
+ LANDFIRE Website
Scenes from the Polar Night
Landsat satellites have begun regularly acquiring images of ice at the poles during the winter, with enlightening results.