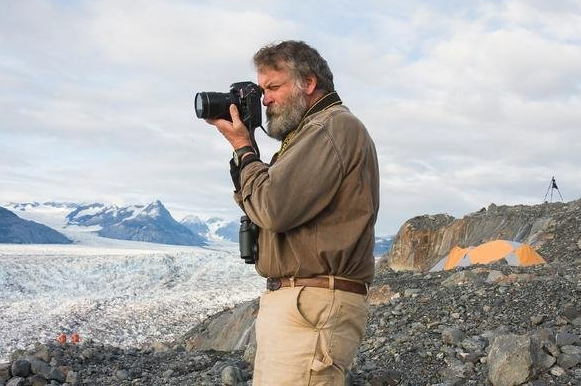
The team mapped and catalogued some 198,000 glaciers around the world as part of the massive Randolph Glacier Inventory, or RGI, to better understand rising seas over the coming decades as anthropogenic greenhouse gases heat the planet. Led by CU-Boulder Professor Tad Pfeffer and Trent University Professor Graham Cogley, the team included 74 scientists from 18 countries, most working on an unpaid, volunteer basis.
The project was undertaken in large part to provide the best information possible for the recently released Fifth Assessment of the Intergovernmental Panel on Climate Change, or IPCC. While the Greenland and Antarctic ice sheets are both losing mass, it is the smaller glaciers that are contributing the most to rising seas now and that will continue to do so into the next century, said Pfeffer, a lead author on the new IPCC sea rise chapter and fellow at CU-Boulder’s Institute of Arctic and Alpine Research.
“I don’t think anyone could make meaningful progress on projecting glacier changes if the Randolph inventory was not available,” said Pfeffer, the first author on the RGI paper published online today in the Journal of Glaciology.
Since the world’s glaciers are expected to shrink drastically in the next century as the temperatures rise, the new RGI—named after one of the group’s meeting places in New Hampshire—is critical, said Pfeffer. In the RGI each individual glacier is represented by an accurate, computerized outline, making forecasts of glacier-climate interactions more precise.
“This means that people can now do research that they simply could not do before,” said Cogley, the corresponding author on the new Journal of Glaciology paper. “It’s now possible to conduct much more robust modeling for what might happen to these glaciers in the future.”
As part of the RGI effort, the team mapped intricate glacier complexes in places like Alaska, Patagonia, central Asia and the Himalayas, as well as the peripheral glaciers surrounding the two great ice sheets in Greenland and Antarctica, said Pfeffer. “In order to model these glaciers, we have to know their individual characteristics, not simply an average or aggregate picture. That was one of the most difficult parts of the project.”
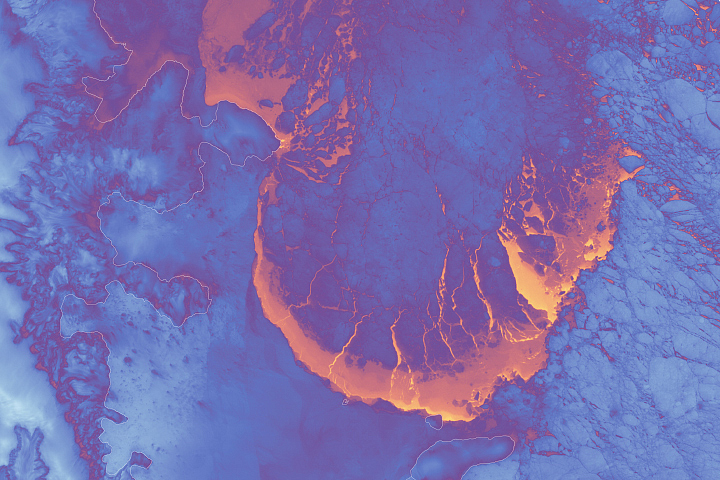
The team used satellite images* and maps to outline the area and location of each glacier. The researchers can combine that information with a digital elevation model, then use a technique known as “power law scaling” to determine volumes of various collections of glaciers.
In addition to impacting global sea rise, the melting of the world’s glaciers over the next 100 years will severely affect regional water resources for uses like irrigation and hydropower, said Pfeffer. The melting also has implications for natural hazards like “glacier outburst” floods that may occur as the glaciers shrink, he said.
The total extent of glaciers in the RGI is roughly 280,000 square miles or 727,000 square kilometers—an area slightly larger than Texas or about the size of Germany, Denmark and Poland combined. The team estimated that the corresponding total volume of sea rise collectively held by the glaciers is 14 to 18 inches, or 350 to 470 millimeters.
The new estimates are less than some previous estimates, and in total they are less than 1 percent of the amount of water stored in the Greenland and Antarctic ice sheets, which collectively contain slightly more than 200 feet, or 63 meters, of sea rise.
“A lot of people think that the contribution of glaciers to sea rise is insignificant when compared with the big ice sheets,” said Pfeffer, also a professor in CU-Boulder’s civil, environmental and architectural engineering department. “But in the first several decades of the present century it is going to be this glacier reservoir that will be the primary contributor to sea rise. The real concern for city planners and coastal engineers will be in the coming decades, because 2100 is pretty far off to have to make meaningful decisions.”
Part of the RGI was based on the Global Land Ice Measurements from Space Initiative, or GLIMS, which involved more than 60 institutions from around the world and which contributed the baseline dataset for the RGI. Another important research data tool for the RGI was the European-funded program “Ice2Sea,” which brings together scientific and operational expertise from 24 leading institutions across Europe and beyond.
* From Pfeffer et al.’s Journal of Glaciology article: “Most of the glacier outlines in the RGI with known dates were derived from satellite imagery acquired in 1999 or later. Various Landsat platforms, principally Landsat 5 TM and Landsat 7 ETM+, were the primary sources, and imagery from ASTER, IKONOS and SPOT 5 high-resolution stereo (HRS) sensors was also used.”
Further Reading:
+ International team maps nearly 200,000 glaciers in quest of sea-level rise estimates
+ “The Randolph Glacier Inventory: a globally complete inventory of glaciers,” from the Journal of Glaciology