Contributor: Susan Moran, U.S. Department of Agriculture
For farmers and land managers, increasing crop yields and cutting costs while reducing environmental pollution is a constant challenge. To accomplish this goal, many farm managers are looking for new technologies to help them decide when and where to irrigate, fertilize, seed crops, and use herbicides. Currently the decisions are based on very limited data collected in “spot checks” from the ground.
Recent technological advances in geographic information systems (GIS) and computer modeling are playing a part in farm management and precision farming. Using data collected by satellites, important agricultural factors like plant health, plant cover and soil moisture can be monitored from space, providing a much bigger picture of the land surface that can be combined with other technologies to help cut costs and increase crop yields.

Susan Moran, a US Department of Agriculture Agricultural Research Service soil scientist, based in Phoenix, AZ, developed a method to help farmers with resource management by combining Landsat images with radar data from several polar orbiting satellites. Although Landsat sees the surface very clearly, its usefulness is limited because it can’t see through clouds, and it only flies over a particular area once every 16 days. Most farm management decisions require information on a daily or biweekly basis. Radar can see through clouds and be collected daily, but the resolution is not as good as Landsat. The combination of radar and Landsat gives a continuous record of the land surface and vegetation health.
The thermal band on Landsat can detect crop health by seeing plants transpire, or lose moisture through their leaves-a factor directly related to plant health. When plant transpiration rates decrease, growth rates decrease and the plants appear unhealthy. Managers use this information to target where to fertilize and irrigate. Other Landsat bands can see the extent of vegetation cover while radar can pick up moisture in the soil.
The methods developed by Moran are already in use by land managers through a Cooperative Research and Development Agreement with a commercial image supplier. The 24-hour turnaround of the new Landsat 7 data will enable expanded applications of remote sensing in agricultural and natural resource monitoring.
Images of ERS-2 Synthetic Aperture Radar (SAR) backscatter (Fig. 1, left) and Landsat Thematic Mapper (TM) reflectance (Fig. 1, right) covering the University of Arizona Maricopa Agricultural Center (MAC) in Arizona were acquired on May 19 and May 21, 1997, respectively. The solid lines on the image designate the MAC field boundaries and the total area covers 770 hectares. Moran’s research showed that the complementary information obtained with TM and SAR images was useful for monitoring important agricultural conditions, such as crop growth, soil moisture, cultivation practices, and percent litter cover.

The Water Deficit Index (WDI) indicates the rate of evaporative water loss from cropped fields. It is determined from measurements of field temperature and the spectral vegetation index measured by Landsat. A map of the WDI is a good tool for water conservation, since it can be used to monitor the efficacy of irrigations and identify fields were evaporative water loss is greatest. In this image of WDI at the University of Arizona Maricopa Agricultural Center, one can determine that the cotton in the northern part of Field 7 was being irrigated during the overflight, resulting in the bright green color in contrast with the yellow color of the drier cotton and the red color of fallow fields.
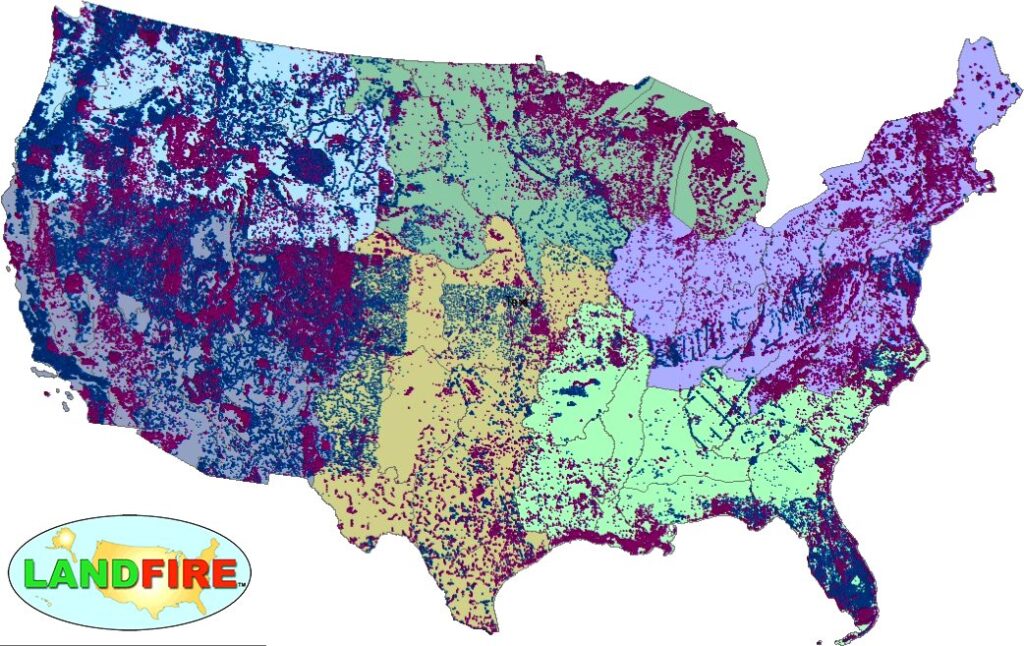
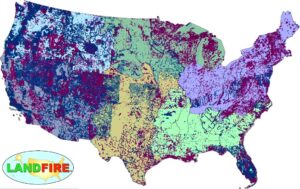
LANDFIRE Remap Is Here
LANDFIRE has released its Remap dataset; new techniques and new data provide significant improvement.