Contributor: David Skole Michigan State University
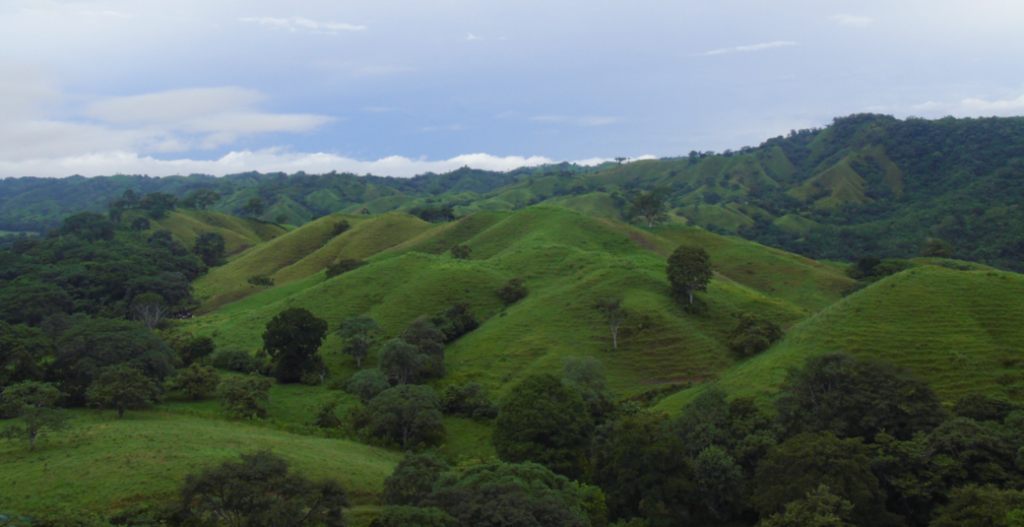
Even though tropical deforestation is a well-known problem, the rate of deforestation in the tropics is currently known to only a very general degree. Recent research using Landsat images of forest loss over a decade from the mid-1970s to mid-1980s found that an average of 6200 square miles of forest were lost each year in the Brazilian Amazon. The annual rate in the smaller Southeast Asia region was estimated to be 4800 square miles per year. A key problem facing scientists today is determining deforestation rates and understanding their causes and effects.
David Skole of Michigan State University is involved in several initiatives to study the rates, causes, and effects of tropical deforestation in the Amazon Basin, Southeast Asia, and Africa. Using Landsat imagery, his research analyzes changes in forest cover at a 30-m resolution and models the effects of this on the carbon cycle. By combining satellite imagery with socioeconomic data, Skole is also searching for the economic and social causes of deforestation.
Using three different wavelength bands of Landsat Thematic Mapper imagery to quantify the vegetation characteristics, Skole’s team categorizes land cover into primary rain forest, regrowing rain forest, agricultural clearings, and other classes. These data are manipulated using a geographic information system to explore patterns and rates of land cover change. The geospatially referenced information is then fed into socioeconomic and terrestrial ecosystem models to explore the causes and effects of deforestation.
Skole’s team has analyzed Landsat 5 imagery from the 1990s for the Brazilian Amazon and Southeast Asia to develop estimates of recent tropical deforestation. In addition, they have performed multi-year studies in the Amazon basin to determine the year-to-year changes in deforestation rates. These data are important not only in yielding the rate of deforestation but for the analysis of carbon uptake by tropical rain forests and for understanding the social and economic causes.
With the launch of Landsat 7, the amount of data available for this research has increased dramatically. Highly detailed, near-real-time analysis is possible with the new imagery, allowing for rapid assessment of land use and land cover change.
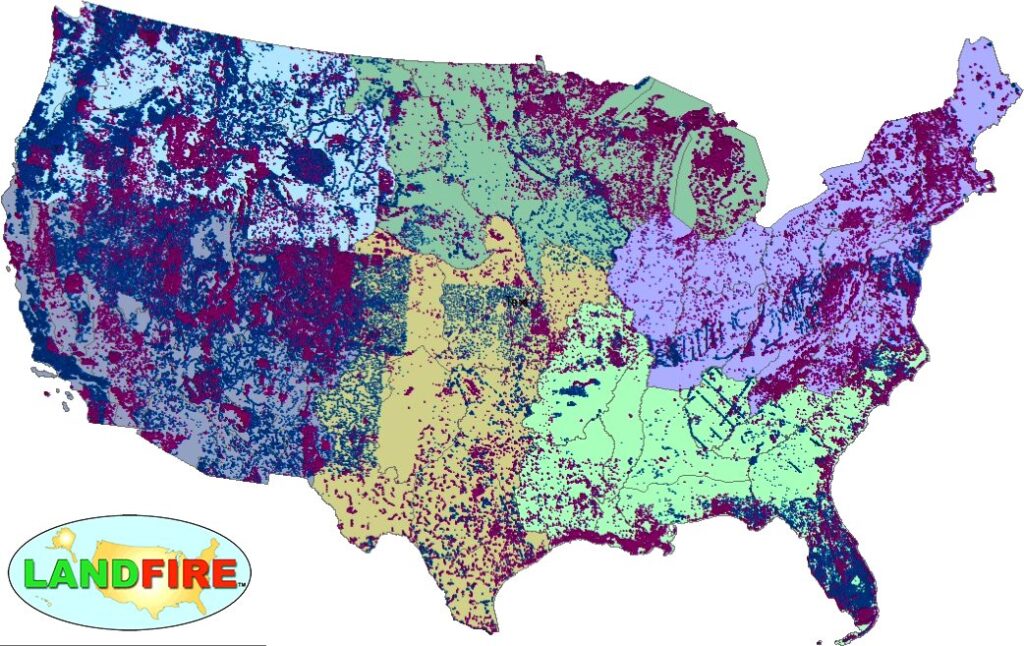
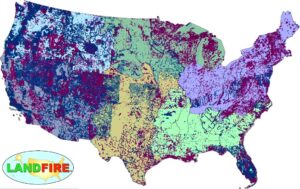
LANDFIRE Remap Is Here
LANDFIRE has released its Remap dataset; new techniques and new data provide significant improvement.