Contributor: Jan van Wagtendonk, U. S. Geological Survey

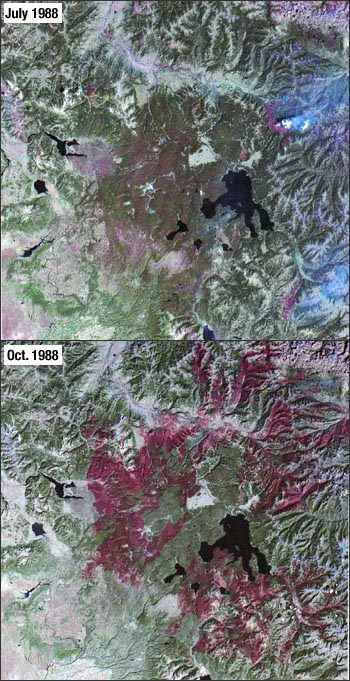
Images from the USGS publication “Historical Landsat Data Comparisons.”
In recent years, wildland fires have become more intense resulting in increased loss of human life and natural resource damage. An important factor in dealing with this problem is information on the amount and condition of dry biomass on the ground, which acts as fuel that feeds wildland fires.
With information about fuels, fire managers can better predict potential fire behavior, make more informed tactical and strategic decisions, and conduct treatments to reduce the amount of dry biomass.
U. S. Geological Survey researcher Jan van Wagtendonk, from the Western Ecological Research Center’s Yosemite National Park station, and Ralph Root, from the USGS Center for Biological Informatics in Denver, have been examining the use of time series of Landsat Thematic Mapper imagery for developing a technique to identify fuel types based on seasonal changes in plant condition.
Six Landsat scenes at one-month intervals during the 1992 growing season were examined using hyperspectral analysis, a type of analysis that deals with large data sets with several spectral bands.
Using time series, changes in annual grasslands, for instance, can be traced as the plants green up in the spring and dry during the summer. This fuel type can be distinguished from alpine meadows which dry at a different rate. Similarly, biomass from deciduous hardwood can be distinguished from evergreen hardwood, which retains its leaves.
Van Wagtendonk has also used single-scene Landsat images to classify different types of fuels over the past five years. Maps produced from this analysis have been used to predict the behavior of two large wildland fires in 1994 and 1995 that were being allowed to burn to meet resource objectives.
The addition of a panchromatic band on Landsat 7 enhanced the capability to distinguish tree density classes, which directly affects fuel moisture content and wind speeds near the ground. Seasonal changes can also be tracked more easily with the more frequent observations of Landsat 7.
Spectral Characterization
The measured wavelength locations of the ETM+ spectral bands are compared to Landat 5’s TM in Table 8.1 The spectral bandwidths are determined by the combined response of all optical

