How, you ask? Something we call “calibration.” Landsat has become known for its rigorously calibrated data—i.e., information that accurately reflects physical conditions of the ground. To make sure that its data are well calibrated, data collected by the satellite’s instruments are closely monitored, especially, measurements of light from sources that scientists already know well.
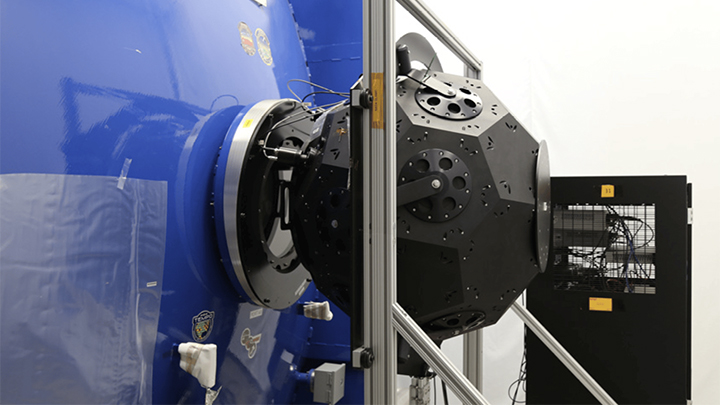
These include onboard Operational Land Imager, or OLI, lamp data (i.e. a source with a known radiance), OLI observations of a solar diffuser of known reflectance, Thermal Infrared Sensor, or TIRS, observations of an onboard blackbody (a warm source of known radiance) and deep space (a cold source of near zero radiance), and lunar measurements.
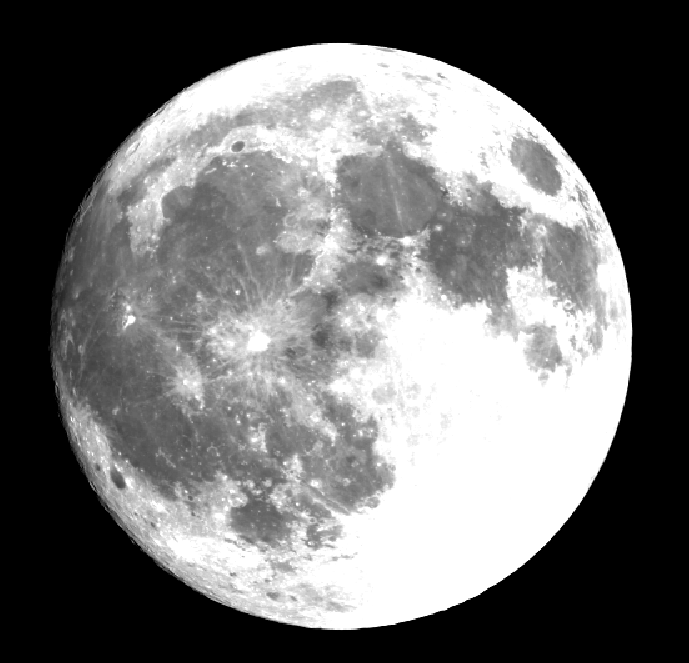
The Moon provides a stable data source because it is a target with practically static surface cover and no atmospheric effects. But scientists must take into account that the Moon’s signal varies significantly with given illumination conditions, such as lunar phase. Observations of the Moon in the late 1990s to early 2000s by ROLO, the RObotic Lunar Observatory, led to the development of a model that provides lunar irradiance for the solar reflective bands. This model, in conjunction with OLI lunar images, allows the Moon to be used for calibration. In this way, data from on-orbit lunar imaging can be used to track the stability of the OLI instrument aboard Landsat.
Data from the Moon is used to both complement and corroborate the results from the other on-board calibration activities. When collecting lunar calibration data, the satellite swings itself into position to point its instruments at the Moon and goes on to perform a series of pitching motions to scan the detector arrays across the Moon. This highly choreographed sequence is the satellite’s most complex maneuver. Landsat 8 typically collects lunar data monthly near full Moon—at the lunar phase angle of about 8 degrees. Any changes to the sensor’s radiometry (i.e. measurements of light) can be detected and used to improve sensor calibration.
Most recently, scientists realized that stray light was getting into the TIRS’ telescope and affecting the measurements of its two infrared bands. It turns out that the light was actually being reflected by something inside the sensor and causing “ghosting” in the images. To understand the problem, the Landsat 8 team needed to image the brightest object with the darkest background available. The Moon, with the dark background of space behind it, turns out to be an ideal test image to help determine exactly where the stray light is coming from so that correction algorithms can be designed to remove the “ghosts” from the images.
Lunar data is collected only for calibration or other engineering purposes, so it is not typically processed and released to the public, but NASA and USGS have decided to put out a sample data set for those eager to look more closely at Landsat 8 lunar data.
Here you can download sample lunar data in HDF5 (.h5) format. This is data from Landsat 8’s very first lunar acquisition on March 26, 2013. It includes data for all OLI bands (for one focal plane module).
The data are available as Level 0R—raw, and Level 1G—radiometrically and geometrically corrected. Keep in mind that without special geometric processing, the Moon is elongated by a factor of ~8 and the instantaneous field of view (IFOV) projected on the Moon at the average distance of 384,400 km is about 16 km, not the 30 m (15 m panchromatic) resolution that OLI has for Earth, which is only 705 km away.
Sample Data Files (to download, control-click or right-click and select appropriate download option from menu):
OLI-sample_lunar_26MAR2013_L1G.h5 (40 Mb)
(radiometrically corrected and geometrically corrected)
OLI-sample_lunar_26MAR2013_L0R.h5 (98 Mb)
(raw)
Further Reading:
+ Preliminary Spectral Response of the Operational Land Imager In-Band, Band-Average Relative Spectral Response
+ Markham, Brain L, Philip W. Dabney, Jeanine E. Murphy-Morris, Jeffrey A. Pedelty, Edward J. Knight, Geir Kvaran, Julia A. Barsi, “The Landsat Data Continuity Mission Land Imager (OLI) Radiometric Calibration.” [PDF]
+ Commissioning the Landsat Data Continuity Mission
+ Landsat 8 Scans the Moon
Scenes from the Polar Night
Landsat satellites have begun regularly acquiring images of ice at the poles during the winter, with enlightening results.