
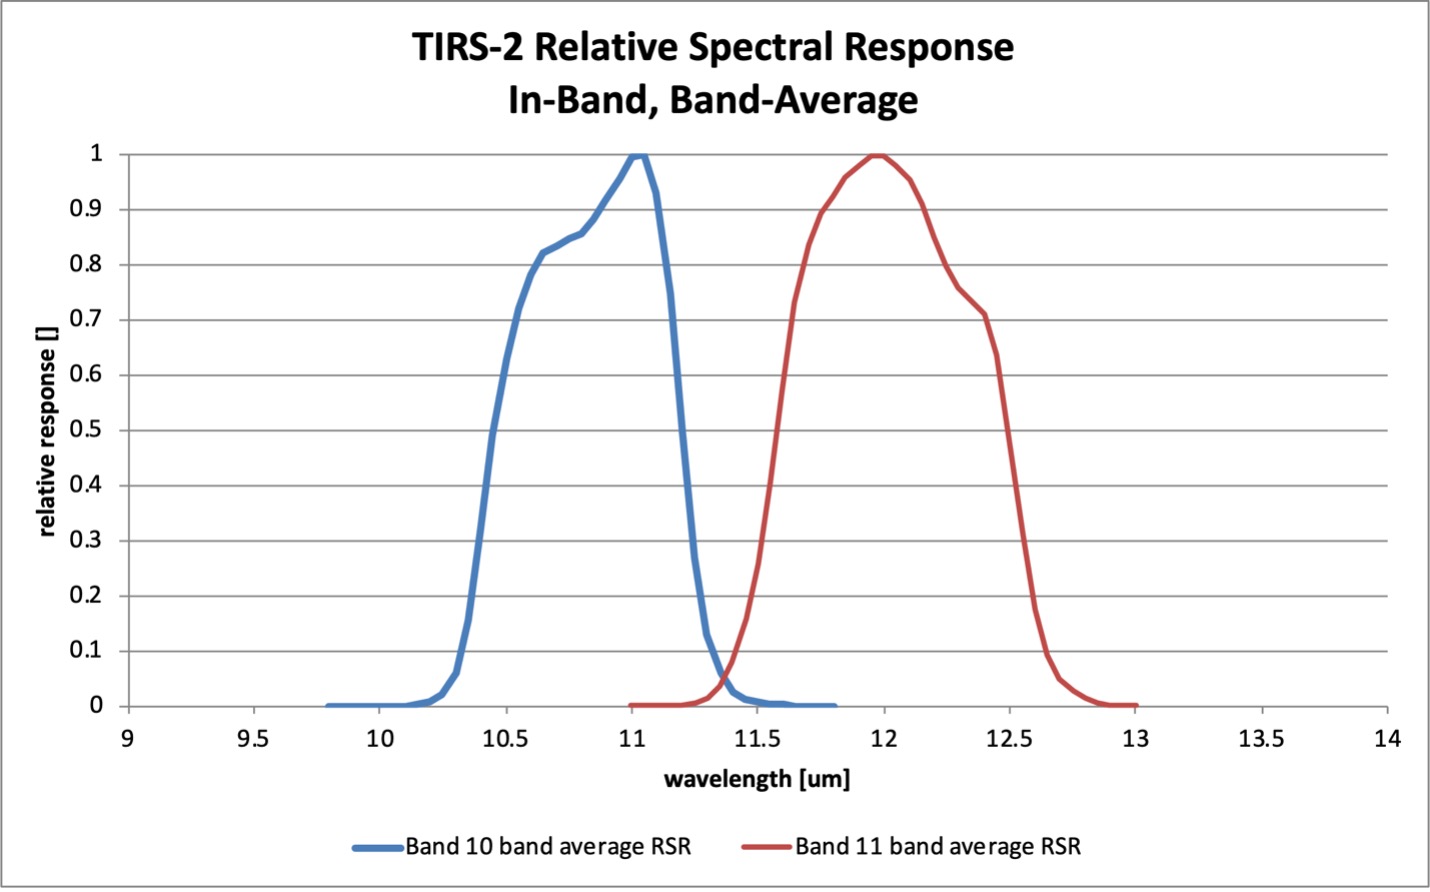
Figure 1. The band-average relative spectral responses of TIRS-2.
The band-average relative spectral responses of the Thermal Infrared Sensor-2 (TIRS-2) are provided (Figure 1). A per-band summary is provided in Table 1. These responses are based on measurements made of the fully assembled instrument under thermal vacuum conditions conducted by the TIRS-2 instrument team at Goddard Space Flight Center.
Band | Band Width [μm] | Lower Band Edge [μm] | Upper Band Edge [μm] | Center Wavelength [μm] |
| Band 10 | 0.75 | 10.45 | 11.20 | 10.83 |
| Band 11 | 0.92 | 11.58 | 12.50 | 12.04 |
Table 1. Summary statistics of the band-average relative spectral responses of TIRS-2.
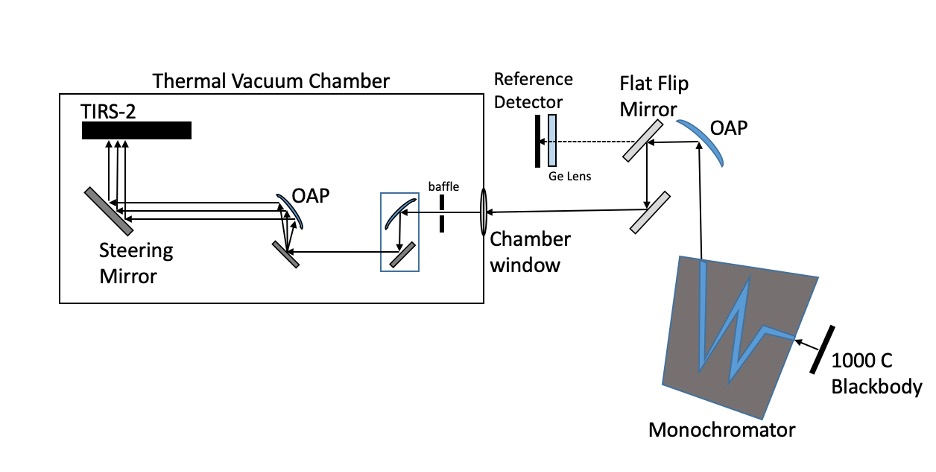
The instrument-level spectral measurements of TIRS-2 were made using a test configuration that has been upgraded and improved since the Landsat-8 TIRS instrument-level test. A detailed description of the test can be found in Pearlman et al 2019.
The TIRS-2 instrument was located inside a thermal vacuum chamber with an optical bench that included a series of calibration support elements, including a steering mirror. A monochromator was set up outside the thermal vacuum chamber. The monochromator was illuminated by a 1000 °C blackbody, which filled the monochromator entrance slit. The monochromator output was collimated and directed through the chamber window by a series of optics. A flip mirror was used to direct the monochromator beam either to the chamber window or to a HgCdTe reference detector. The blackbody signal was chopped so the blackbody could be isolated from the large ambient background.
Inside the chamber, the steering mirror could direct the monochromator beam to any location on the focal plane. The monochromator beam illuminated only a small number of detectors at a time, so several locations on the focal plane were tested in order to characterize low-frequency spatial variations of the spectral response shape.
The spectral measurements were collected over both bands’ in-band regions at 0.05 μm wavelength steps with a bandwidth of about 0.10 μm. A TIRS-2 image was captured with the monochromator beam illuminating each of 15 discrete locations for each spectral band (five on each Sensor Chip Assembly (SCA)). The background-subtracted and linearized TIRS-2 response (dn) was corrected for the reference detector measurement (Vref) to account for the source blackbody spectral shape as well as any spectral dependence of the elements common to the optical path. The spectral transmittance of the chamber window and optics elements inside the chamber (τTIRSpath) and optical elements in the path to the reference detector (τrefpath) were also accounted for. The corrected TIRS-2 response (dncorr) is calculated for each illuminated detector, i, at every measured wavelength, λ.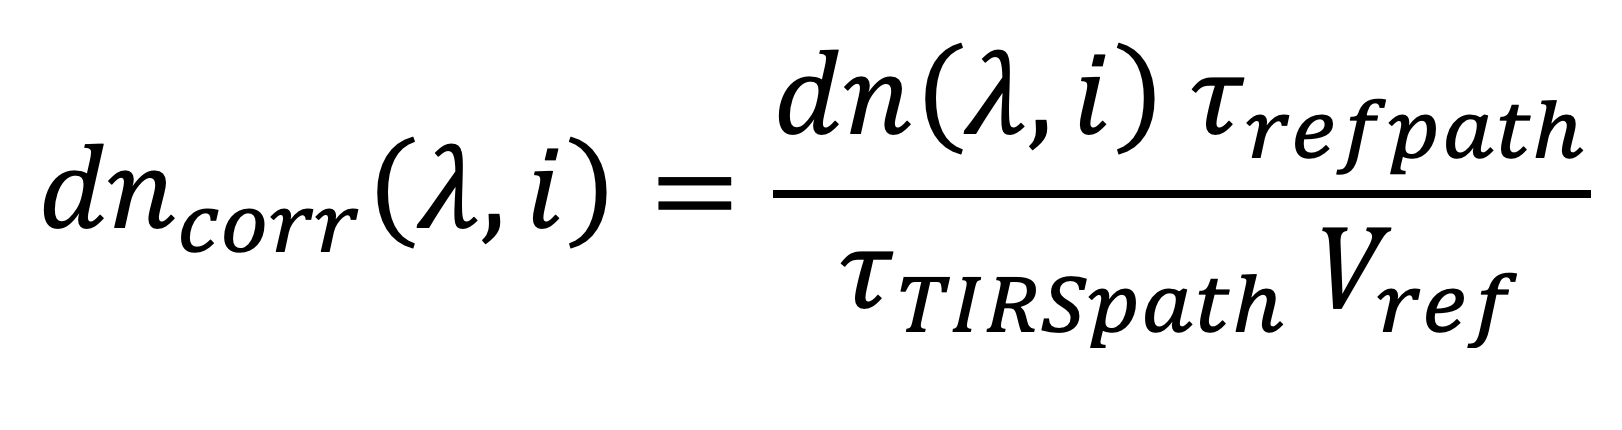
The relative spectral response (RSR) is constructed for each detector by normalizing the corrected response to the maximum response.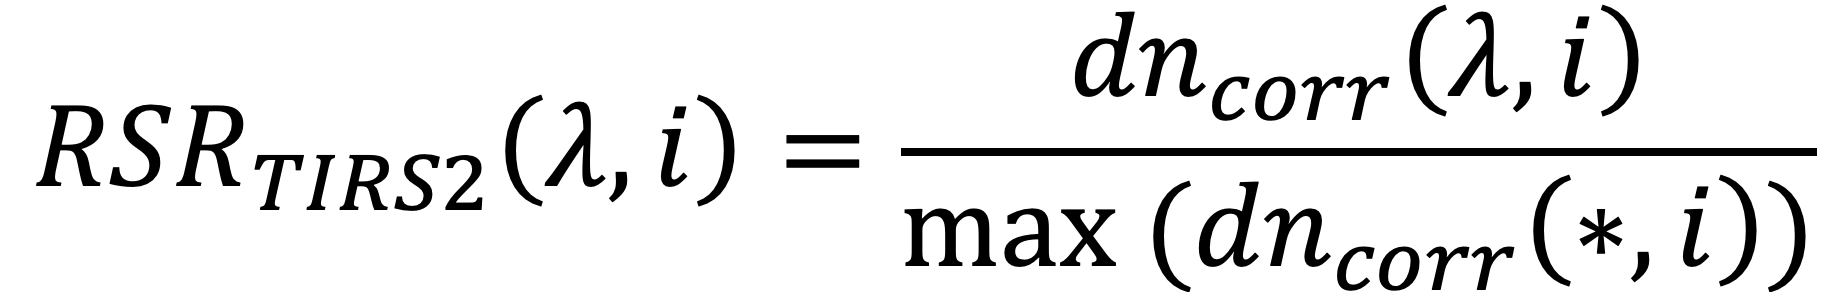
The RSRs of all illuminated detector elements at a given location were averaged and renormalized to the peak to derive a location specific RSR. The band-average spectral response and standard deviations provided here are derived from the 15 location-specific RSRs for each channel. Generally, the RSRs at the five locations taken on each SCA are very similar, while there are small differences in the spectral response shape between the three SCAs.
The spectral response analysis was performed by both the TIRS instrument team and the Landsat project calibration team. The results presented here are from the TIRS instrument team analysis.
The band-average spectral responses are provided here for each band. More details on the measurement of the TIRS-2 spectral responses can be found in [Pearlman 2019].
References:
TIRS-2 Design
A. J. Pearlman, B. Efremova, A. Lunsford, J. McCorkel, A. Simon and D. Reuter, “Landsat 9 Thermal Infrared Sensor 2 Spectral Response Test: Updates And Perspective,” IGARSS 2019 – 2019 IEEE International Geoscience and Remote Sensing Symposium, 2019, pp. 8534-8537, doi: 10.1109/IGARSS.2019.8899118.
