Scientists that study polar ice have realized a hidden talent of the Landsat satellites: seeing in the dark. With this recognition comes more work for the current Landsat fleet, which is now more frequently collecting detailed data over Earth’s high latitudes during periods of low or no sunlight.
Since the 2022 launch of a special expanded data collection program called LEAP (Landsat Extended Acquisitions of the Poles), the Landsat 8 and 9 missions have started to build year-round image records of glaciers, ice shelves, and sea ice around Antarctica, Greenland, and the Arctic Ocean. The resulting glimpses into the polar night are helping scientists better track ice formation and decay in these rapidly changing regions.
Despite Landsat’s robust track record of imaging our planet since 1972, the highest latitudes have mostly gone unmapped during winter when sunlight fades. However, scientists have periodically made special requests that fall outside of Landsat’s standard acquisition plan to collect images of sea ice during dark months. It was from these observations that scientists realized Landsat can discern details on the surface of ice and track its winter formation and movement, even with low or no light.
In addition to collecting visual, near-, and shortwave-infrared images with the OLI (Operational Land Imager) and OLI-2 sensors, the Landsat 8 and 9 satellites also acquire thermal infrared (heat) data with the TIRS (Thermal Infrared Sensor) and TIRS-2, respectively. These instruments offer better spatial resolution than other commonly used satellite thermal sensors and can better distinguish glacial ice and ocean features such as ice fronts, rifts, sea ice leads, and polynyas.
Through the LEAP plan, the satellites have consistently imaged sea ice at both poles, even when the Sun is below the horizon. “We’re taking darkness out of the equation,” said Christopher Crawford, Landsat project scientist and data acquisition lead at the U.S. Geological Survey (USGS). “Extending the ability to observe ice and polar ocean changes increases the probability of capturing major glacier calving events, wind-driven surface melting or warming, and coastal ocean ice shelf breakup that can be expected to occur more frequently in the future if the pace of warming does not slow.”
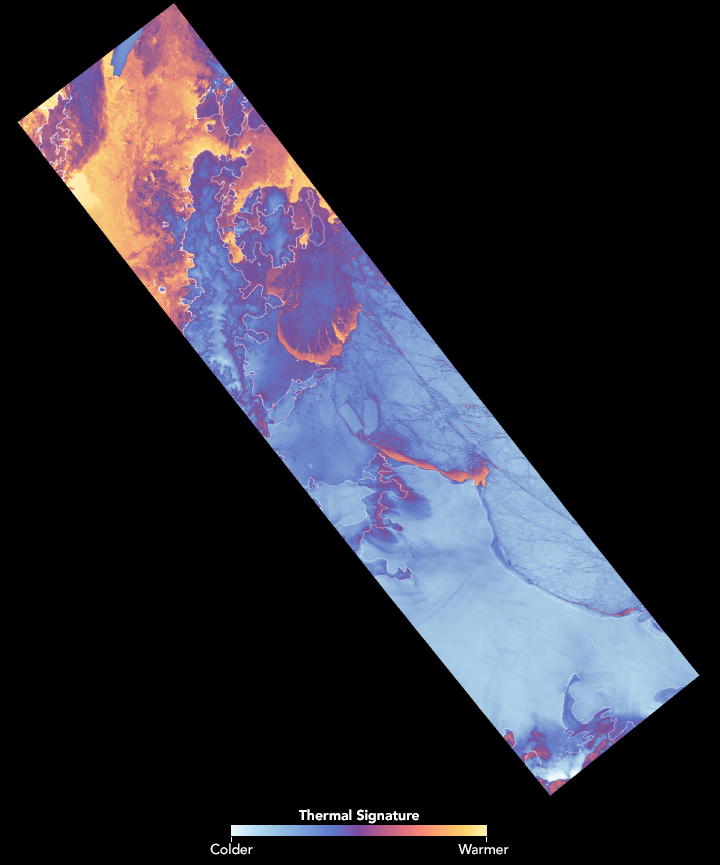
This mosaic of five images along the Antarctic Peninsula highlights the level of detail and variety of ice features that Landsat thermal imaging can reveal. The images were acquired during the austral winter on July 23, 2023, by TIRS on Landsat 8. Yellows and oranges indicate areas with warmer temperatures, like open water or thin sea ice, while blues denote colder temperatures, like areas of thick ice.
The mosaic is notable because, even with extended observations, clouds can get in the way. The clear view of such a large area prompted Christopher Shuman, a University of Maryland, Baltimore County, glaciologist based at NASA’s Goddard Space Flight Center, to call this set of scenes a “unicorn.”
At the top, the Southern Ocean northwest of the Antarctic Peninsula is the warmest part of the image, juxtaposing snow-covered land areas. “The contrast between the cold polar ice and the warmth that’s preserved in the ocean waters is so evident,” Shuman said.
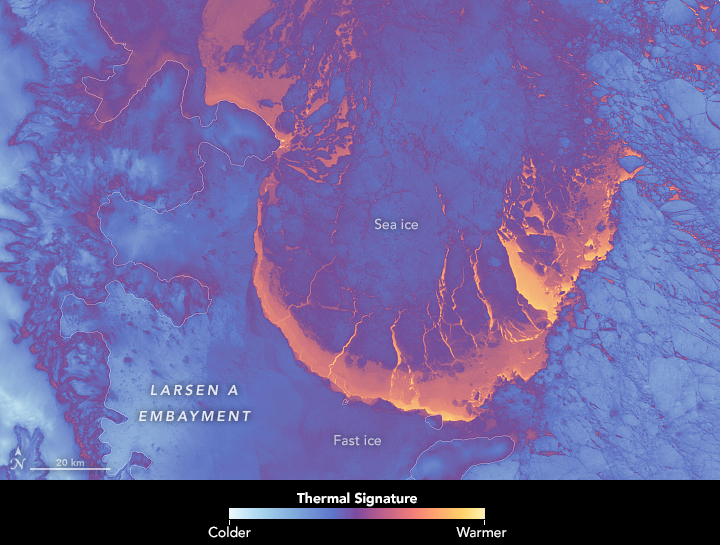
Along the eastern side of the Antarctic Peninsula, two large sections of the greater Larsen Ice Shelf once floated in the Larsen A and B embayments. Now, instead of containing the floating extensions of glacial ice from land, the embayments often fill with seasonal sea ice. Much of this “fast ice” clings to coastlines and ice shelves, helping to resist the seaward flow of glaciers and slowing their contribution to sea level rise. In this image, arced areas of warmer temperatures indicate thinner ice or open water where sea ice is being blown offshore, away from fast ice in the Larsen A and B embayments.
Features in the image get considerably colder to the south. Outside of the Larsen B embayment, thicker sea ice with visible rifts, as well as icebergs A-76B and A-76C, float in the Weddell Sea. Those bergs broke away from a tabular iceberg that was at one time the world’s largest. They are still 300-400 meters thick and may be dragging across the seafloor, said Shuman.
At the bottom of the mosaic, the Larsen C Ice Shelf is a uniform, cold (light blue) expanse. Under clear-sky conditions, flat snow and ice surfaces radiate heat to space, creating a thin, chilled layer of air that pools at the surface and contributes to its cold appearance. In places with more topography, even a calm wind will disrupt this layer and cause surface features to give off a warmer signal. In this way, thermal imagery can map topography in relatively fine detail. The warmer appearance of the Jason Peninsula separating Larsen B and C illustrates this phenomenon.
Finally, along the right side of the image, linear features called leads run through the sea ice in the Weddell Sea. These cracks in the cold, stiff ice are evidence of a shear zone, Shuman explained. Here, the Weddell Gyre causes shearing as it circulates clockwise and pushes ice into warmer waters to the north. In contrast, sea ice closer to shore moves more slowly.
Through LEAP, Landsat imagery is now collected systematically in the winter and can help address gaps in knowledge about ice dynamics. For example, Crawford noted, scientists might better quantify how coastal sea ice modulates the flow of land ice into the ocean, which has implications for sea level rise. They may also learn more about winter ocean water temperatures and circulation, and how that affects ice shelf stability.
The longevity of the Landsat program has proven the power of long-term Earth observations. To build the longest possible time series for the poles, the USGS is working to reprocess earlier satellite images to make them more useful for comparison with modern imagery. And now, with plans underway for the Landsat program’s continuation, LEAP aims to show the value in extending systematic, year-round polar observations.
Landsat Next, the new Landsat mission targeted to launch in the early 2030s, will have improved spatial and temporal resolution, as well as spectral bands especially suited for snow and ice observations.
“This is really an exciting time for Landsat polar science, a new era so to speak,” said Crawford. “With Landsat Next on the horizon, the LEAP special request program and its observations of Earth’s polar regions—and the global cryospheric state more broadly—can only be expected to grow in impact and relevance.”
Related Reading
+ Landsat Images the Twilight Zone, USGS Eyes on Earth