>

stella_dataviewer

1.2.1

about
connect_device
X

Help

The ‘Graphs’ section of the sidebar is used to select which graphs are visible on screen. Simply click on an index to have it toggle on or off. When an index is selected, it will highlight in black. A total of four graphs are shown on the screen at one time.

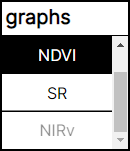
*Note that if an index is grayed out, you will need to select a calibration batch.*

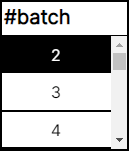
The ‘#Batch’ section of the sidebar is used to select which batch is currently visible. Simply click on a batch number to have it displayed on the graph. When a batch is selected, it will highlight in black and any other indices you have selected will be updated.

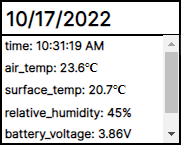
The ‘extra info’ section of the sidebar is used to contain data from the selected batch that cannot be represented in a graph. This includes the date, time, air temperature, surface temperature, relative humidity, battery voltage, and UID number.

The ‘distance’ section of the sidebar is used to determine the distance at which the currently selected batch was taken from its subject in cm. This value is important in accurately calculating reflectance.

The ‘calibration batch’ section of the sidebar is used to select which batch to compare against for various indices. Once selected, the values of this batch will be averaged over time and used to calculate the reflectance for the currently selected batch.

To trim the currently selected batch, select the content_cut icon. Once selected, two sliders on each end of the timeline will appear. Click and drag each slider to the desired start and end point, and click done to save your changes.

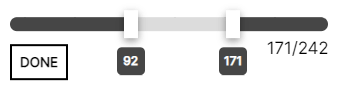
*Note that clicking ‘done’ will remove the data you have trimmed. However you can always re-upload your data file to recover previous changes you have made.*

To download your data, click the download icon. Once clicked, the currently selected batch will download automatically as a .csv file. This file can be re-uploaded to perform the same graphing as before.

To record a graph, click on the ‘Record’ button in the bottom left corner. Once clicked, a timer will appear displaying the amount of time you have recorded. To stop recording, click the ‘Record’ button again and a new tab will appear with your video file. Once your file has fully loaded, click the hamburger icon in the bottom right corner to download the file as a .mp4.

*Note that only the ‘RAW’ graph is available for video recording because all other indices will not change as the timeline is moved.*

To capture a static image of your graph, click on the camera_alt button in the bottom left corner. Once clicked, a .png file will automatically download to your computer.

The ‘RAW’ graph refers to the unfiltered data that are received directly from the STELLA device. Data values are recorded as irradiance measurements at the following wavelengths:

Visible: 450nm, 500nm, 550nm, 570nm, 600nm, 650nm.

Near Infrared: 610nm, 680nm, 730nm, 760nm, 810nm, 860nm.

Toggling ‘Visible (filtered)’ or ‘Infrared (filtered)’ on top of the graph will show the current data points filtered through each sensor's calibration curve.

'NDVI' 'Normalized Difference Vegetation Index'

NDVI = (NIR - RED) / (NIR + RED)

The output range of NDVI is -1 to +1. If the NDVI value is negative, it is probable that your subject is water, barren rock, or an impervious surface. If the NDVI value is close to +1, there is a high likelihood that your subject has dense green and photosynthetically active vegetation. NDVI values that are close to zero suggest that the subject has little to no vegetation.

Since NDVI corresponds to photosynthetic activity, it has broad applications in remote sensing. In agricultural studies, NDVI has been used to assess crop biomass and to monitor the fraction of plant cover in specific fields. Specifically, models based on NDVI have been developed to predict winter wheat yield at large scales. In forestry applications, NDVI measurements can provide important information about forest dynamics and it can be used in conjunction with a suite of other biophysical and meteorological variables to model wildfire risk

'SR' ('Simple Ratio')

SR = R860/R650

Vegetation indices are commonly used as quick indicators of relative crop condition (e.g., as compared to prior observation).

'NIRv'('Near-infrared reflectance of vegetation')

NIRv = NDVI * NIR

*If NIRv is grayed out, you will need to select a calibration batch and determine the distance in which the subject was recorded*

Paul Mirel: Device creator, designer, and lead engineer

Petya Campbell: Lead scientist

Jesse Barber: Cal/Val scientist

Michael Taylor: Project coordinator and presenter

Ross Walter: Dataviewer designer and programmer

1
4
DONE
1/100
download
content_cut
equalizer
visibility
Record
camera_alt
Raw Data
Visible (filtered)
Infrared (filtered)
visibility
camera_alt
visibility
 / 
camera_alt
visibility
camera_alt
visibility
camera_alt
visibility
camera_alt
visibility
camera_alt
visibility
camera_alt
visibility_off
camera_alt

FILTERED VISIBLE LIGHT

read
equalizer
visibility
equalizer
visibility
refresh
Record data every:  
  seconds
0.9
UID: 8535
2020-12-07
13:35:19Z
Surface: 21.0C
nm: uW/cm^2
Air: 20.4C
V450: 8.9
610: 1.4
B500: 11.8
680: 1.1
G550: 10.2
730: 1.1
Y570: 10.5
760: 1.1
O600: 10.5
810: 1.0
R650: 11.1
860: 1.3
The #batch section of the sidebar allows you to select which batch you are currently viewing
<
>
SKIP