Contributor: Laura Rocchio

Year-to-year we expect the price of bread to remain relatively stable, but rarely do we realize the complex interactions and activities that are responsible for that price stability. And even less often do we realize that Landsat satellite data are behind the accurate global crop production estimates that enable such price stability.
Let’s back up. Stable food prices are the result of a delicate balance between food supply and demand. To drastically simplify: if agricultural supply is too high, prices fall to a level where farmers cannot afford to plant, if supply is too small, food prices can soar. So, an unstable agricultural commodities market can lead to wild food price fluctuations––much like the gas price fluctuations caused by recent oil market swings.
Market intelligence and why it maters to you
Market intelligence about global crop production ensures that food supply is consistent with demand. If, for example, Australia has a bumper crop of wheat, U.S. farmers can avoid a wheat glut (and protect against a precipitous price drop) by not planting wheat, and vice versa. Accurate crop estimates thereby translate into dependable food prices by enabling producers to make wise planting decisions and by equipping U.S. agricultural commodity traders with the knowledge they need to set realistic and reasonable prices.
The Foreign Agricultural Service (FAS) of the U.S. Department of Agriculture (USDA) has the responsibility of providing this market intelligence in the form of timely, objective, unclassified, global crop condition and production estimates, for all major commodities, for all foreign countries. These estimates are an integral part of the World Agricultural Production and World Agricultural Supply & Demand numbers used by the U.S. Office of Management and Budget (OMB) as Principle Federal Economic Indicators. To accomplish this Herculean task, FAS synthesizes information from its global network of marketing experts, agricultural economists, meteorologists and remote sensing scientists.
While FAS attachés collect crop production information from foreign government reports and fields visits, it is the comprehensive view afforded by space-based Earth-observing satellites, such as Landsat, that provide the unbiased, global, farm-level observations necessary to objectively verify these reports. Unbiased report verification means food supply estimates can be used with confidence.
“Less confidence in the food supply translates into more volatile markets where food shortages and over-stocks are more likely to occur,” says Dr. Bradley Doorn a Technical Remote Sensing Coordinator with FAS. It was a grain shortage 35 years ago that initially led FAS to use Landsat data.
The Great Grain Robbery
After a number of years with abnormal weather in the early 1970s, wheat crops in much of the world failed. At the same time, very successful wheat crops in the U.S. had led to large U.S. stockpiles of wheat. In only six weeks, and before the U.S. realized there was a global wheat shortage, shrewd Soviets traders were able to surreptitiously purchase $750 million worth of U.S. wheat at low subsidized prices.

By time the U.S. became aware that there was a shortage of wheat on the global market, the Soviets had bought 15 million tons of U.S. wheat (up from 300,000 tons in years past). With the U.S. grain supply suddenly low, wheat prices soared (reported increases range from 200% to 350%) from June 1972 to February 1974.
“Food prices rose dramatically and the impact on the world grain markets and food availability was dramatic,” Doorn explains. Steep price increases meant that many undeveloped nations could not afford to buy grain, and grain-producing nations were forced to pay a premium for the extra fuel and fertilizer needed to meet demand.
To put this in perspective, imagine that yesterday you bought a loaf of bread from your local grocery story for $2.89. Can you imagine paying between $5.78 and $10.12 for that same loaf of bread in 2009? That’s what happened in the early 1970s in what has come to be known as the Great Grain Robbery.
Determined never to be blindsided on the commodities market again due to a lack of information, OMB instructed FAS to establish a global crop surveillance and reporting system.
“FAS has been mandated to provide a global crop reporting system including a global crop surveillance program since the mid-1970s starting with Landsat 1,” Doorn says.
Coincidently, the first Landsat satellite was launched the same year as the Great Grain Robbery. Data from Landsat 1 made it possible for FAS to meet OMB’s mandate to monitor global crop.
Thirty years and counting
Over the past three decades, the objective global crop production estimates made with Landsat data have contributed to U.S. food security, economic security, national security, and more recently, homeland security. Post-9-11, the FAS mandate was expanded to include foreign crop supply estimates needed for critical response to any catastrophic crop failures or bio-terrorist attacks (think of the recent E. coli spinach scare on a much larger scale).
Unfortunately, the FAS has become increasingly reliant on foreign Earth-observing satellites since 2004. Through 2003, FAS relied on about 3000 Landsat scenes per year for global crop production estimates and support of domestic programs.¹ In late May 2003, a hardware glitch aboard the Landsat 7 satellite reduced the amount of usable data per scene by about 25%, and forced FAS to look to foreign satellites for the data they required.
Today, FAS is almost completely reliant on data purchased from an Indian satellite (IRS). Additionally, FAS uses data from the French SPOT satellite and they are investigating the use of data from a Brazilian and Chinese satellite (CBERS).
With the current global coverage limitations of Landsat, data from Landsat 5 and Landsat 7 are only used for historical comparisons, domestic gap filling, and data validation and verification. And, after several changes in implementation strategy , the launch of the next U.S. Landsat-like satellite is still several years away.
While it is fortunate that foreign satellites have been able to fill the void left by the Landsat 7 instrument anomaly, the merit of depending on foreign data for matters of national, economic, and homeland security is debatable.
“A loss in the Landsat coverage is equivalent to losing an irreplaceable, objective, timely, and reliable intelligence source,” Doorn admits. “Increasingly global markets affect commodity prices and our imports/exports,” he continues.
In 2005, the U.S. exported over $63B of agricultural products (approximately 10% of U.S. exports). But in this age of globalization, U.S. economic dominance in agriculture is being challenged and the marketing edge that FAS crop estimates give to U.S. producers has never been more important.
In 2003, South America surpassed the U.S. in soybean production for the first time in history. A year later, a dispute with Brazilians over Brazil’s soybean production estimates highlighted how FAS crop production numbers affect the U.S.’s ability to effectively argue estimates.
“The nature of how FAS uses Landsat imagery is most visible when problems, disagreements, or anomalies occur,” Doorn says. Today, FAS must increasingly rely on foreign-based satellite information. It remains to be seen if FAS’s reliance on foreign-based satellites will affect their ability to respond to events.
¹ FAS manages the USDA Satellite Imagery Archive (SIA) which is a centralized clearinghouse for other USDA agencies to share satellite imagery.

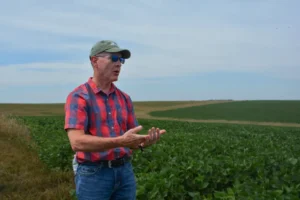
NASA’s Brad Doorn Brings Farm Belt Wisdom to Space-Age Agriculture
Bradley Doorn grew up in his family’s trucking business, which hauled milk and animal feed across the sprawling plains of South Dakota. Home was Mitchell, a small town famous for its Corn Palace, where murals crafted from corn kernels and husks have adorned its facade since 1892—a tribute to the abundance of the surrounding farmland.