Mar. 19, 2013 • The great strength of Landsat is its ability to let data users look at and analyze changes to the Earth’s landscapes from 1972 to the present. Accurate quantitative analysis of such change is dependent on consistent Landsat data from Landsat instrument to instrument (i.e. the Multispectral Scanner, Thematic Mapper, Enhanced Thematic Mapper Plus, and now LDCM’s Operational Land Imager and Thermal Infrared Sensor) as well as consistent information from each individual instrument over time. To this end, a dedicated calibration and validation team of NASA and USGS scientists and their university partners monitor the behavior of the Landsat instruments to ensure stability in the data products. In the case when a change in the instrument is considered significant enough to require rectification, the team updates the processing parameters in the Calibration Parameter File (CPF) used to process Landsat scenes. The calibration team recently submitted a change to the CPF for Landsat 7’s ETM+ instrument based on observed changes in reflectance measurements over a stable Saharan desert site over the past 13 years. These changes will be implemented starting April 1, 2013.
From the Landsat Calibration Team:
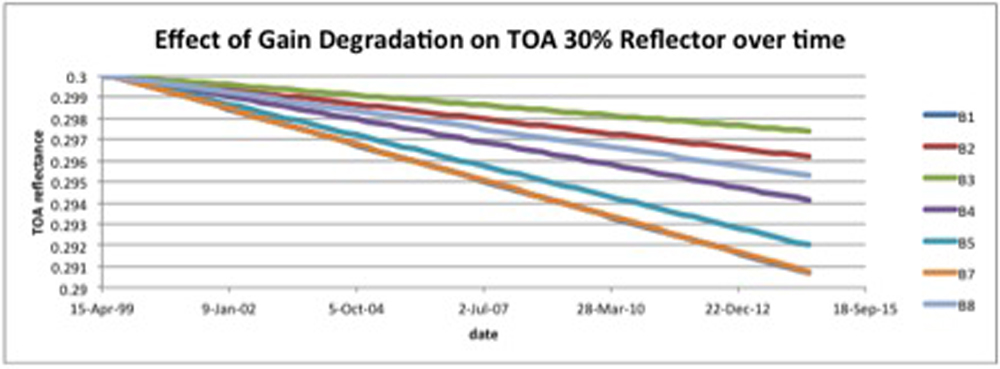
Analysis of large, unchanging desert sites in the Sahara has shown that the gains of the ETM+ instrument have degraded over the lifetime of the sensor. The degradation has been slow, a maximum of -0.21% change per year, but over 13+ years of operation, this amounts to calibration errors of up to 2.8%. The degradation is significant in all reflective bands.
The effect of the degradation is to make targets appear darker over time. For example, in the Blue band, a 30% reflector in 1999 would appear to have a reflectance of 29.5% in 2006 and 29.2% in 2012.

Our current, best estimates of the gain change come from the ETM+ lifetime response to path 181 row 40, encompassing the Libya-4 site (referenced in Cosnefroy et al. 1996). The gains are modeled as linear functions of time. The gain changes below are listed here as percent (of the starting gain) change per year along with a 2-sigma uncertainty and the degradation in percentage over the lifetime (relative to the current Calibration Parameter File, or CPF):
| Band | Gain Change (%/year ± 2δ) | Lifetime % Degradation | |
| 1 | Blue | -.021 ± 0.09 | -2.8 |
| 2 | Green | -0.09 ± 0.07 | -1.2 |
| 3 | Red | -0.06 ± 0.05 | -0.8 |
| 4 | NIR | -0.13 ± 0.09 | -1.8 |
| 5 | SWIR-1 | -0.18 ± 0.07 | -2.4 |
| 7 | SWIR-2 | -0.21 ± 0.13 | -2.8 |
| 8 | Pan | -0.10 ± 0.07 | -1.4 |
A more detailed description of the processing and analysis can be found in the proceedings of IGARSS 2012, though the numbers here are slightly different due to number of data points being used in the final assessment.
H. Cosnefroy, M. Leroy, and X. Briottet, “Selection and characterization of Saharan and Arabian desert sites for the calibration of optical satellite sensors,” Remote Sensing of Environment, Vol. 58, pp. 101-114, 1996.
Barsi, Markham, Helder. “In Flight Calibration of Optical Satellite Sensors Using Pseudo Invariant Calibration Sites” IGARSS 2012, Munich, Germany, July 22-27, 2012.
+ Past calibration Landsat 7 ETM+ updates from USGS Landsat


