Contributor: Laura Rocchio
“Chronic water supply problems in many areas of the West are among the greatest challenges we face in the coming decades.” Mark Limbaugh, the U.S. Department of the Interior’s (DOI) Assistant Secretary for Water and Science, told U.S. Senators in 2006.
He was largely echoing the findings of the DOI Water 2025 report. The report explains that if future conflict over water in the West is to be avoided, water efficiency needs to improve. Until then, conflict and environmental degradation will be the costs of the increasing demands—dominated by agricultural irrigation and swelling city populations—on limited water supplies.
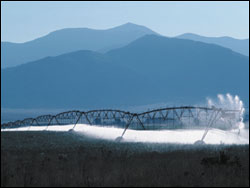
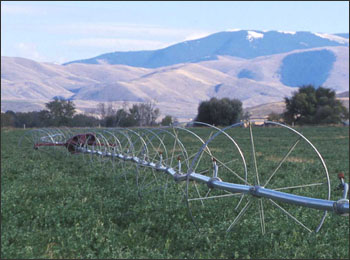
Irrigation: a numerical explanation
rrigation accounts for 80% of fresh water use in the U.S and worldwide, the World Bank estimates 70% of fresh water use is for agriculture. The U.S. irrigates over 50 million acres of agricultural land and 32 million acres of recreational landscapes (lawns, golf courses, etc.). The total volume consumed by agriculture and landscape irrigation is 50 trillion gallons per year; western states are responsible for 86% of that consumption.
A growing problem
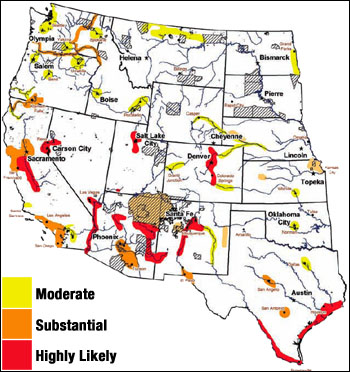
The arid U.S. West is experiencing explosive population growth. The 2000 Census reported that one third of all Americans live in the West, and that the West accounted for half of the overall U.S. population growth over that decade.
Seven of the ten fastest growing U.S. cities are found in the West and Albuquerque, El Paso, Las Vegas, and Tucson will not be able to supply enough water for their burgeoning growth with present sources. Recent drought brought about bitter legal battles for the precious water resources of the Rio Grande River highlighting that the river’s waters are stretched thin between the city of Albuquerque, farmers, endangered species, and local Native Americans.
As the West grows, water conservation is coming to the forefront. Water 2025 states, “today’s water supply issues require innovative, locally based approaches that identify solutions in advance of water supply crises.”
Conserving water with Landsat
Increased demand for scarce water supplies has shifted water management strategy from increasing water supply to innovatively managing water use at sustainable levels. To more effectively allocate limited water supplies, water resources managers must understand water consumption patterns over large geographic areas.

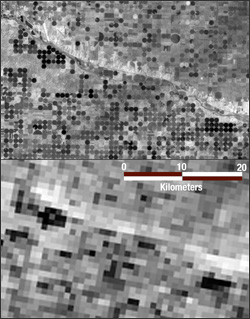
Detailed water consumption maps can be made quickly and easily with Landsat because of its 30 m spatial resolution and thermal imaging capability. Landsat has been proclaimed “the best and least expensive way to quantify and locate where water is used and in what quantity,” by Anthony Morse and Richard Allen, two water management specialists from Idaho.
Former World Bank economist, Dr. Chris Perry, predicts that, “We may expect significant improvements in the productivity of water—the crop per drop—by the analysis and debate facilitated by better data.”
Landsat data have been used successfully not only to quantify water consumed by irrigation, but also to establish water rights, to facilitate the transfer of water entitlements, and to estimate aquifer depletions and quantify net ground-water pumpage in areas where water extraction from underground is not measured.
Understanding Landsat’s role
Landsat data, including visible, near infrared, mid-infrared, and thermal information, for a particular geographic region are fed into a relatively sophisticated energy balance model that outputs evapotranspiration maps.
Evapotranspiration (ET) refers to the conversion of water into water vapor by the dual process of evaporation from the soil and transpiration (the escape of water though plant’s stomata). For vegetated land, ET is synonymous with water consumption. Maps of water consumption made with moderate resolution Landsat data enable water resources managers and administrators to determine how much water was consumed from individual fields. And, because the spatial nature of Landsat data lends itself to the monitoring of seasonal evapotranspiration trends, managers can use the information to determine which complex irrigation schedules should be pursued and how to time water releases from dams.
“Remote sensing, applied to the measurement of ET over large areas, provides analysts of irrigation systems with extraordinary new tools for the objective assessment of consumption and production—constituting a quantum leap in the assessment of irrigation system performance,” Perry wrote in 2003.
Accuracy
“Satellite analysis provides a far more objective and consistent set of information about who is consuming what than the ‘traditional’ methods of analysis, which rely on complex equations and huge data sets to give information that has relatively low validity beyond the point of computation––thus being readily challenged by interested parties on the grounds that conditions are different where they irrigate,” Dr. Perry says.
Traditional ground-based estimates of ET have substantial uncertainly and are cumbersome, slow and expensive to implement for large areas. Landsat-derived ET has shown much better certainty. Dr. Wim Bastiaanssen, director of Scientific Affairs & Irrigation at WaterWatch BV (Netherlands) and the main creator of the Surface Energy Balance Algorithm for Land (SEBAL) which uses Landsat data to calculate ET, reports that, “for a range of soil wetness and plant community conditions, the typical accuracy at field scale is 85% for one day and it increases to 95% on a seasonal basis.”
Accuracy for Landsat-derived ET is judged in comparison to either records from pumping stations, wells and diversion points or data from precision weighing lysimeters (scientific measuring tools for calculating ET).
How Landsat has helped in the U.S.
Water resources management in New Mexico, California, Montana, Florida, Washington, Nevada, and Idaho has been aided by Landsat-derived ET maps. Landsat ET estimates have also helped states honor their water consumption limits set by interstate compacts. For example, the waters of the Bear River are divided among the states of Idaho, Utah and Wyoming, and each state needs to know how many acres of land they can develop with irrigation before exceeding their water apportionment.
In Idaho, water resources managers rely on Landsat ET maps for water rights management, regulation, sale, and agreement negotiations. Their use of Landsat data was recently recognized as one of the Top 50 innovations in American government for 2007 by the prestigious Ash Institute for Democratic Governance and Innovation, part of Harvard University’s Kennedy School of Government.
In Washington, Landsat ET estimates have helped to increase the flow of the Yakima River while maintaining the monetary level of crop production. In New Mexico, Landsat ET maps have helped water managers strike a balance between irrigation demands and riparian vegetation requirements. And in California, Landsat has helped create a statewide water use plan that helps farmers determine their actual irrigation needs.
Landsat on the international scene
“Satellite imagery, especially in the thermal bands, can and will revolutionize the establishment of water rights in the many parts of the world where they are insecure,” says Perry, who has worked on many water resources projects in developing countries.
Outside of the U.S., the contentious issue of securing water rights can be limited by data. “There are numerous aid programs from large donors such as the World Bank and Asian Development Bank that want to help manage water resources more effectively and productively, but nobody has the proper data,” Bastiaanssen says, but he continues, “with Landsat we can map out soil moisture, water consumption, water stress, crop yield.”
Increasingly, the World Bank must deal with the overdraft of aquifers. They have labeled the unsustainable water mining “critical” in the North China Plain, Jordan, Mexico, Northern India, Israel, Palestine and Yemen. Meanwhile, Landsat has helped the World Bank successfully manage water projects in China, Mexico, and Yemen, as well as Egypt, Saudi Arabia, Uzbekistan, and Kazakhstan.
In Turkey, Pakistan, Sri Lanka, India and China remote sensing has been demonstrated as a key tool for the strategic planning of water productivity on a basin wide scale.
Benefits of Landsat data over other sensors
Four important characteristics of Landsat explain its prominence in water resources management. Most importantly, Landsat collects thermal imagery. It also collects visible, near infrared, and shortwave infrared data all at a reasonably high spatial resolution, plus, the data have been collected regularly and archived since 1982.
Thermal imaging
“The thermal imager of Landsat is a critical component of the surface energy computations that we conduct to determine evapotranspiration,” explains Allen.
The thermal band allows managers to calculate the full surface energy balance and thereby estimate water consumption by both agricultural irrigation and urban landscaping that is much more accurate than estimates made using short-wave data alone.
A closer look
Landsat’s spatial resolution (30 m for the reflective bands, and 60 to 120 m for the ETM+ and TM thermal bands, respectively) fills a special niche in the world of water resources management. Landsat’s swath is wide enough to provide a synoptic view of a large region while at the same time its resolution is high enough to identify individual fields––which are typically ten to 160 acres (180 to 750 m per side) in the U.S.
“Actual consumptive use of water is needed if misuse of water is to be proved or water scarcity confirmed, and generally this needs to be done on a field-by-field basis,” according to Morse. While there are other Earth-observing satellites that regularly collect thermal imagery, their low resolution makes field-level ET analysis impossible.
A closer look
The ASTER satellite with its thermal band and smaller pixel size could potentially be used for field-based analysis, but it does not have a regular collection schedule and its archive is minimal. Landsat not only has an appropriate spatial resolution for field-based analysis, it has regular global coverage and a robust data archive.
The ability to identify trends in water consumption caused by vegetation growth and weather systems requires frequent coverage. Landsat 7 systematically images the U.S. every 16 days. Landsat 5 has the same repeat cycle but it is eight days out of phase with Landsat 7, so until 2003, Landsat images of the U.S. were available every eight days. The failure of the Scan Line Corrector aboard Landsat 7 in May 2003 has largely diminished the utility of the data for ET calculations.
A retrospective look
Conflict resolution in matters of water resources management can involve quantifying historical water consumption trends for a given region. Because there has been a thermal imager on the Landsat satellites since 1982 and there is regular data collection, which USGS faithfully archives, such retrospective looks can easily be done with Landsat, unlike other high-resolution platforms that only acquire data when specially scheduled.
Growing use
Since 2000 there has been an “explosive increase in use of Landsat data” for water management according to Allen. This increase in the use of Landsat data for ET mapping is attributed to the decreased data cost, successful research in developing countries, dependable processing routines, and advances in computational power and storage. There has also been an increase in water rights litigation and pressure from state water resources entities for an operational product.
A future without a Landsat thermal band and an international plea
No thermal band is currently planned for the Landsat 7 follow-on satellite mission, known as the Landsat Data Continuity Mission (LDCM). The prospect of the U.S. launching a Landsat satellite without thermal imaging capability has led to a cry of protest from water resources managers around the world.
With a likelihood of no thermal band on LDCM, the World Bank has lobbied the European Space Agency (ESA) for a suitable thermal imager. Douglas Olson, a Principal Water Resources Engineer for the World Bank recently sent a letter to ESA specifically asking for a thermal band on their SENTINEL satellite.
Show me the money
Like most decisions, political and otherwise, having a thermal band on future Landsat missions is a matter of money. In order to show the intrinsic worth of a thermal band, water managers have attempted to quantify the monetary benefits of the improved water efficiency made possible with thermal data from Landsat.
The benefit of Landsat-induced water efficiency can best be quantified by examining improved food yields. In the industry, water mangers talk about the “crop per drop” number, how much food can be produced with a given amount of water.
An example of improved crop per drop can be found in North Africa. Egypt and Sudan control about 80 cubic kilometers per year of Nile River flow for irrigation. The productive value of that water, meaning the value of the wheat, rice, cotton and other agricultural products produced using this controlled water, is $0.05 to $0.10 per cubic meter. Conservative estimates state that better water allocation could improve that productivity by more than 10 percent per year, which is a value of $400M to $800M per year. (Note: in Nile Delta study areas monitored between 1995 and 2002, crop yield increases were much more dramatic: rice yields up by 53% and cotton yields up by 41%).
In the U.S., irrigated crops are worth $70 billion per year, so, sustaining the productivity of irrigated land is paramount to the U.S.
By another metric, the value of Landsat’s thermal band to water managers can be estimated by looking at the potential savings that Landsat-based calculations offer as opposed to traditional calculation methods. Traditional methods of calculating water consumption involve monitoring pumping stations, wells and diversion points. This involves many man-hours and can rarely provide all of the necessary information for effective resource management.
For the eastern Snake River Plain in Idaho, the cost of this type of traditional monitoring costs the state half a million dollars per year. In comparison, the same monitoring done with Landsat data is $80,000. When looking at the western states together, Morse has estimated a potential ten-year savings as high as $1B.
Beyond the dollar signs
In psychologist Abraham Maslow’s famous survival pyramid, the Hierarchy of Needs, physiological and security needs are considered the most basic human necessities. Water can affect both.
Feeding an ever-growing human population depends on good irrigation practices, not on the discovery of new sources of water. Scientific technology (such as Landsat) will allow managers to make more informed decisions to maximize the all-important crop per drop.
The essentiality of water makes water rights a contentious issue. Landsat data analysis allows the regulation of irrigators who jeopardize the delicate water balance by consuming more water than their water rights entitle. In the U.S., lengthy legal battles have been fought over water rights and in northern Africa where Sudan and Egypt monopolize the Nile’s stream flow, upstream nations have openly mentioned resolving water disputes with military action. With good water management practices, such conflicts can be avoided.
According to Perry, “satellite data provides the equivalent of a freedom of information act on water use, which can only lead to better decisions and policies for the future.”
Download a footnoted version of this article (PDF)