Contributor: Jeffrey G. Masek, NASA Goddard Space Flight Center

Traffic jams and air pollution in large metropolitan areas are sure signs of expanding populations. Across the globe, 50 percent of the world’s population now lives in urban areas, a gain of over one billion individuals in the last 30 years. In the United States, urban growth can be counted in a census, but how do these expanding populations affect the landscape? Are urban areas making good use of limited space or are they succumbing to urban sprawl? How do factors like zoning policies and environmental pressures influence the expansion of populations over the land?
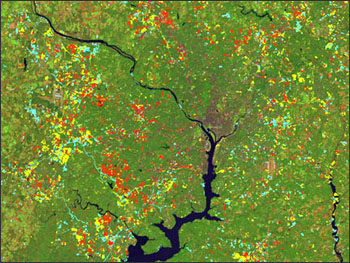
Jeffrey Masek and Frank Lindsay, formerly geographers of the University of Maryland, use Landsat data to study land use efficiency, which is the amount of land area used by increasing populations. Using Landsat data acquired between 1973 and 1996, Masek and Lindsy mapped the growth of the Washington D.C. metropolitan area.
They found that the Washington area has expanded at a rate of 8.5 square miles (22 square kilometers) per year with notably higher growth during the late 1980s, a trend that followed the regional and national economy. They also found distinct variations in the efficiency of land use among neighboring counties in Maryland and Virginia, in part reflecting the land use policies of these jurisdictions.
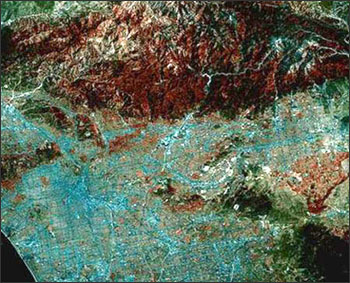
Observing urban areas over time with satellite imagery can also be used to make predictions about future growth. Landsat imagery can show where the growth is taking place and help geographers evaluate how different urban planning programs effect population growth and land use, according to Masek. Cities such as Portland, OR., have strict planning and environmentally sensitive zoning laws, while many Southwestern cities have grown with few planning guidelines.

With Landsat 7 observations, Masek and colleagues intend to evaluate growth patterns of other cities around the world. With a greater number of images available, Masek can compare cities once every two years to capture detailed records of land use changes.

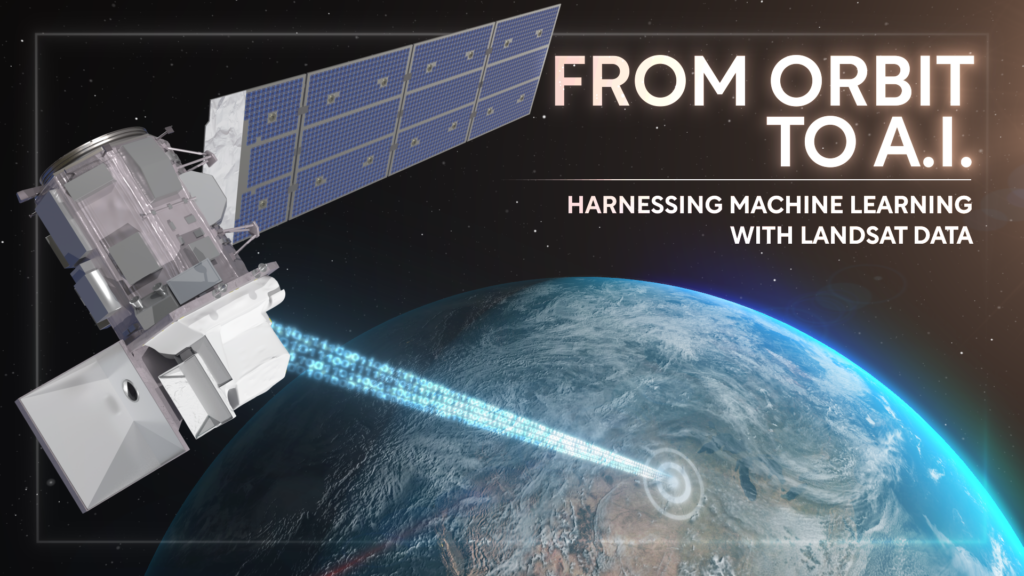
From Orbit to A.I.—Harnessing Machine Learning with Landsat Data
Over the past few years, machine learning techniques have been increasingly used to analyze the vast amount of data collected by the Landsat mission, which has been circling the globe for over 50 years.


