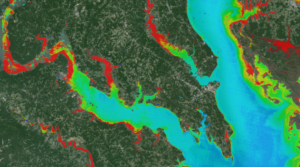
This video, produced by Matt Radcliff and animated by Alex Kekesi, shows how various spectral bands of Landsat data can be put together, or composited, to create color images. In this video—that we fondly refer to as the “onion skin”—watch how different Landsat spectral bands can tell us distinctive information about our planet; here, we take a look at Florida’s Everglades:
Further Information:
+ Landsat 8 Onion Skin

Be Part of What’s Next: Emerging Applications of Landsat at AGU24
Anyone making innovative use of Landsat data to meet societal needs today and during coming decades is encouraged to submit and abstract for the upcoming “Emerging Science Applications of Landsat” session at AGU24.


