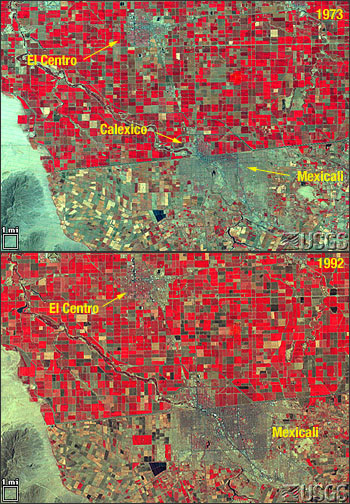
Location: California-Mexico Border
Source: USGS Earthshots

These images show the different land use patterns of El Centro, California, and the urban area of Mexicali/Calexico on the California-Mexico border. From 1970 to 1990, these cities’ populations grew by the following amounts:
El Centro: 19,272 to 31,384 (63%)
Calexico: 10,625 to 18,633 (76%)
Mexicali: 459,900 to 712,400 (55%)

From Orbit to A.I.—Harnessing Machine Learning with Landsat Data
Over the past few years, machine learning techniques have been increasingly used to analyze the vast amount of data collected by the Landsat mission, which has been circling the globe for over 50 years.


