
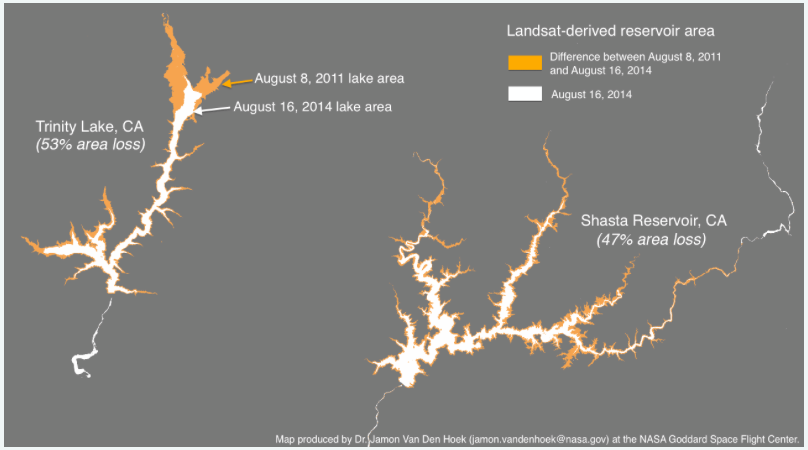
Because changes in reservoir volume impact the surface area of reservoirs, Landsat imagery was used to estimate the change in surface area from August 2011 to August 2014 for two of California’s largest reservoirs: Shasta Reservoir and Trinity Lake, both located about 170 miles northwest of Sacramento, CA. The outlets of the two reservoirs are located approximately 15 miles apart. These reservoirs provide water for irrigation, hydroelectric power, and flood control.
View full presentation here:
+ California drought, visualized with open data

Be Part of What’s Next: Emerging Applications of Landsat at AGU24
Anyone making innovative use of Landsat data to meet societal needs today and during coming decades is encouraged to submit and abstract for the upcoming “Emerging Science Applications of Landsat” session at AGU24.


