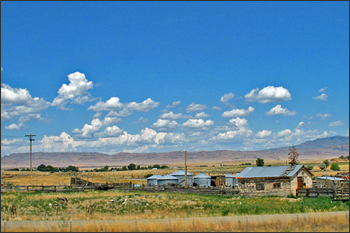
Dean Stevenson has farmed the plains of south-central Idaho most of his forty-seven years. Like all farmers, he worries about things like the price of sugar beets and malt barley or the cost of gasoline, but most of all, he worries about water.
He is right to worry. The 4,000 acres he farms with his father and brother receive on average a scant 10 inches of rain per year. The water that sustains the sugar beets, barley, wheat, and potatoes growing on Stevenson land is pumped from the Snake River Plain aquifer. Every drop is rationed.

Stevenson is part of a water district—the Magic Valley Ground Water—that helps manage water taken from the aquifer. In 2006, another irrigation district on the Snake River Plain, A&B, believed that some of the farms in its district had run short on water, resulting in a poor harvest. Because A&B has senior (older) water rights, Idaho law allowed them to issue a water call, a demand that junior water right holders, including Stevenson, draw less water from the aquifer.
The agency with the unenviable task of sorting out water calls is the Idaho Department of Water Resources. The agency keeps track of how much water is in the state’s rivers and ground water to ensure that Idaho has a viable water supply for all of its users—farmers, cities and towns, and natural ecosystems.
Idaho uses more water than any other U.S. state except California and Texas, the two most populous states. More than 90 percent of the water consumed in Idaho goes to irrigate 3.4 million acres of farmland, providing the economic base for the state. In recent years, some of the department’s most detailed information on how much water farmers consume has come not from water meters on the ground, but from innovative space-based estimates of the evaporation of water from soil and plants.
The new method holds enough promise for Western water management—a challenge that population growth and climate change are likely to intensify in coming decades—that it influenced the design of the next satellite in NASA’s decades-old Landsat program, now jointly managed by NASA and the United States Geological Survey.
The Challenge of Measuring Water Use
When the A&B water call came in to the Department of Water Resources, Tony Morse, the geospatial technology manager (recently retired), and Bill Kramber, a remote sensing analyst, had just started to analyze water use throughout the state during 2006. The department had been using satellite-based estimates of water use for a couple of years at that point.
The challenge in refereeing water disputes, or managing a water supply in general, has always been figuring out how much water is actually being used. Most of us think of ‘water use’ as the water we are billed for every month. But for state water managers, ‘water use’ has a different meaning.
Water resource managers are like bankers: they track the entire water supply like bankers track all of the money in their bank. Each individual water user has the right to withdraw the water in his or her account. But when people withdraw water for washing dishes or taking showers, most of it flows back into the sewers. And when farmers irrigate their fields, some of the water runs back into rivers or soaks into the ground.
Since a portion of all water withdrawals are re-deposited into the water supply, it is as if funds are simply being transferred from one individual account to another in the bank. Since the total amount of water in the bank hasn’t changed, the water has not been ‘used’ from the water manager’s perspective.
Water is only used, or “spent,” when it is removed from the bank entirely, and that happens when it evaporates from the ground or is soaked up by growing plants and released (transpired) as water vapor during photosynthesis. A water meter, such as those on the wells that Dean Stevenson uses to pump irrigation water from the Snake River Plain aquifer, tracks how much water a user withdraws, but not how much is actually spent.
To track farmers’ water spending, the Department of Water Resources needs to measure evapotranspiration (evaporation plus transpiration) across millions of acres of cropland. Previously, they estimated evapotranspiration for each county from temperature, humidity, wind speeds, and sunlight measured at regional weather stations.
That approach works to track the total amount of water in the bank, but it falls short for deciding how much water an individual user is spending. Water is managed on a field-by-field basis, notes Morse. Conflicts occur on a field-level basis. To settle water disputes like the A&B water call in 2006 and to make decisions about future water use, the department needed to measure evapotranspiration at the field level for the entire state—a formidable task.
“Remote sensing was the only way to throw a rope around all the water consumption going on in Idaho,” says Rick Allen, a water resources engineer at the University of Idaho. With a grant from NASA in 2000, Allen and Morse began looking for ways to use data from the Landsat satellites to estimate evapotranspiration across the Snake River Plain and other farmland in Idaho. With the ability to see the ground in greater detail than many other science satellites, the Landsat satellites were NASA’s missions specifically designed to study the Earth’s land surface. Landsat sees 30 meters square in a single image pixel—the perfect resolution for monitoring individual fields of crops.
Modeling Evapotranspiration
The idea of mapping evapotranspiration with Landsat data was not new. In fact it was a problem scientists had been trying—mostly without success—to solve for two and half decades.
Landsat doesn’t measure water vapor directly, but evaporating and transpiring water takes energy, something Landsat does observe. If they knew how much energy was going into driving evapotranspiration, Morse and Allen could estimate how much water a particular field of crops had consumed on any particular day.
Energy—mostly solar energy—at the surface of the Earth can either heat the ground, heat the air, or be used in evapotranspiration. To find the amount of energy available to drive evapotranspiration, then, scientists knew they would have to simply subtract the energy used to heat the air and the ground from the total available energy. Landsat makes measurements of most of these pieces of the energy budget, so calculating the total energy is a relatively straightforward thing.
The amount of energy that heats the ground is also a straightforward calculation. It depends on how much heat is already in the ground and how much vegetation covers the ground, since plants shade the ground. Landsat measures both land surface temperature and vegetation, and those measurements can be used to figure out how much of the available energy is going into heating the ground.
Calculating the amount of energy used to heat the air posed a much bigger challenge. “That’s the lion we have to tame,” says Allen. The energy used to heat the air near the ground comes from the ground itself: it is the heat you feel rising from a parking lot or your car’s dashboard on a hot day. The transfer of energy between the ground and the air is driven by the temperature difference between them, something that changes as often as the land surface changes. It also depends on wind and the way it plays over Earth’s surface. “We cannot see wind [over land] from a satellite,” says Allen.
“Twenty to twenty-five years ago, people at Goddard [Space Flight Center] and other places were working on this same problem. They were wanting to calculate evapotranspiration using surface energy balance using Landsat thermal data, and they concluded it could not be done,” says Allen.
The problem, he explains, was that they were trying to be too precise. As good scientists, they wanted to calculate the heat transfer to the atmosphere directly using Landsat’s measurements of surface temperature along with ground measurements of the air temperature. But there was just enough uncertainty in the air temperature and surface temperature measurements that they couldn’t calculate the heat transfer accurately.
A Short Cut to Water Use
It took someone with an entirely different perspective to tame the lion; it took a Dutch engineer who was more interested in practical applications than the exacting precision of science. Engineer and humanitarian Wim Bastiaanssen wanted to find a way to calculate water use so that he could help developing countries find ways to use water more efficiently to grow food. Allen had heard of Bastiaanssen’s work at a conference and thought his approach might work in Idaho.
“He [Bastiannssen] said, look, we just don’t know surface temperature accurately enough, we don’t know air temperature accurately enough. So how about if we just invert this whole process…Let’s just back-calculate what it [the heat transferred to the atmosphere] has to be to explain what we know about evapotranspiration,” says Allen.
Bastiaanssen asked, are there any conditions in a Landsat image where we know what the evapotranspiration is? “The answer is yes,” says Allen. “There are two extreme conditions that we know.” First, little to no evapotranspiration occurs in bare, dry soil. Such a pixel will appear hot in Landsat thermal images. By assuming the amount of heat being used for evapotranspiration was zero (or nearly zero) in this pixel, and knowing the ground surface temperature, Bastiaanssen discovered that he could calculate how much of the incoming solar energy was being transferred to the air as heat at that one location.
Bastiaanssen then set his eyes on the other extreme: he found nearly the coldest pixel in the thermal data. (The coldest pixels, says Allen, are usually standing water or data artifacts.) Since evapotranspiration cools the surface, a cool pixel in an agricultural area would be one that is plant-covered; at that location, it would be reasonable to assume that most of the available energy is being used in evapotranspiration, not heating.
Once the scientists knew how much of the available energy was being transferred to the air at the two extremes (the places with the lowest and highest evapotranspiration rates), they simply calculated the mathematical relationship between them, which looked like a gently sloping curve on a graph. The relationship defines the difference between surface and air temperature without requiring a precise measurement of either. Figuring out how much energy was being transferred to the air at other, intermediate, places was simply a matter of figuring out where those locations would fall along the curve.
“I can take that relationship between temperature gradient and surface temperature and apply it to all 30 million pixels in my image,” says Allen. “From that I calculate evapotranspiration for every pixel.”
When Allen, Morse, and Kramber began adapting Bastiannssen’s approach to Idaho, they used precise calculations of evapotranspiration from agricultural weather stations near water-intensive crops, rather than assuming that virtually all the energy in a scene’s coldest pixel was being used in evapotranspiration. Because they knew the evapotranspiration rate from ground measurements, they could combine that with Landsat observations of ground heating to calculate even more precisely how much energy was transferred to the air over the crop.
Since they could now calculate how much of the available energy was heating the ground and the air, they could estimate how much was being used for evapotranspiration. In other words, they now had a way to see water “spending” for every 900-square-meter area of land (a 30 meter pixel): they could see just how much water was being consumed from field to field.
Putting METRIC to Use
Allen’s model is called METRIC, for “Mapping Evapotranspiration at high Resolution with Internalized Calibration,” and by 2003 METRIC was beginning to run as an operational model at the Idaho Department of Water Resources. Within a short span of time, METRIC was being used to solve a wide variety of problems.
Regional planners asked for METRIC data to decide if turning a farm into a residential subdivision near Boise would require more or less water. METRIC showed that the subdivision would consume less water. METRIC was used to find a balance between farmers and fish by showing how much water the farmers were consuming and how much could have remained in the stream for endangered fish. The information helped the state plan realistic limits on the amount of water that can be drawn from a stream.
When the A&B water call came in 2007, recalls Kramber, “our bureau chief came to us and asked if there was any type of imagery-based data that would help supply information.” The department had Landsat-based evapotranspiration data for three days during the summer of 2006. “We thought if that area is short of water, we should be able to see that on those images,” he said.
To determine if farmers in the A&B district had been damaged by water shortages, all Kramber and his colleagues had to do was compare water use, which they got from evapotranspiration measurements in METRIC, to vegetation growth, which Landsat measures directly. They compared these measurements for the A&B district to surrounding farms that relied on both ground water and surface water.
“It just didn’t look like the area was any different than the surrounding areas. If it had been short of water, it should have shown a lower evapotranspiration rate,” says Kramber.
The director of the Idaho Department of Water Resources decided that there simply wasn’t enough evidence that A&B farmers had suffered substantially as a result of water shortages. Their fields seemed to be as productive as anyone else’s. The director denied the water call, deciding not to curtail Stevenson and other ground water irrigators in his district. A&B appealed the decision, bringing METRIC into the Idaho court system. The appeals are still in progress.
With his water rights upheld for now, Stevenson sees applications for METRIC outside the courtroom. He sees it as a tool that could help him save money by helping him assess how much water he is actually using. It costs money to pump water from the aquifer, and he only wants to pump what he actually needs. “Water is a finite resource, and whatever we can do to try to maximize and optimize the use of that resource is a good thing for us. Whatever we can do to get better information on what [water] we use, we as producers will benefit from that,” he says.
Changing Landsat for Future Water Management
Within the Department of Water Resources, METRIC has not entirely replaced former methods of estimating evapotranspiration from weather station measurements. Ironically, the hesitation in adopting METRIC completely came from the Landsat program itself. In part because of the history of unsuccessful attempts to use Landsat thermal data to calculate evapotranspiration, the next Landsat satellite, the Landsat Data Continuity Mission, was not designed with an instrument that could take the thermal measurements required for the METRIC model.
Morse and Allen, along with the Western States Water Council, began to push NASA, USGS, and Congress to add a thermal band to the next Landsat mission. “They have been very vocal and very well-articulated with respect to their need for that data,” says Jim Irons, NASA project scientist for the Landsat Data Continuity Mission. As a result, NASA decided to add the capacity to take thermal measurements to the Landsat Data Continuity Mission. “I think if they had not conveyed the value they hold for the thermal data, we would have had a very difficult case to make for restoring the thermal imager,” says Irons. A grant designed to help develop applications for Landsat data had come full circle to affect the design of subsequent Landsat missions.
But the real winners are western water managers, who now have an efficient way to monitor and manage water consumption. “METRIC made an enormous difference,” says Morse. “For the first time, we can map water use on a field by field basis, which is how water is actually managed,” Morse told a board from the Harvard Kennedy School of Government, which in September 2009 awarded the Idaho Department of Water Resources an “Innovations in American Government” award for developing and using METRIC. “We rely on publicly available, non-proprietary Landsat data. This means that the data for all parties to a conflict are consistently processed and equally available to all.”
Contributor: Holli Riebeek, NASA Earth Observatory


