
Q&A series conducted by Kate Ramsayer
Kate Fickas
U.S. Geological Survey Mendenhall Fellow
How do you use Landsat?
I use Landsat to explore wetland and aquatic ecosystem dynamics over time, studying how they may vary in a changing climate. Biotic and abiotic, everything on Earth has its own connection to time.
In the spring, we’re greeted with a wash of color across the landscape when flowers bloom and we know that our favorite lake might be too chilly to swim in until the warmth of summer arrives.
With its 50-year archive, Landsat can help explain complicated, intersecting relationships both within a year and across years to help us understand, locate, map, and monitor important ecosystems and give insight into how we can best protect them into the future.
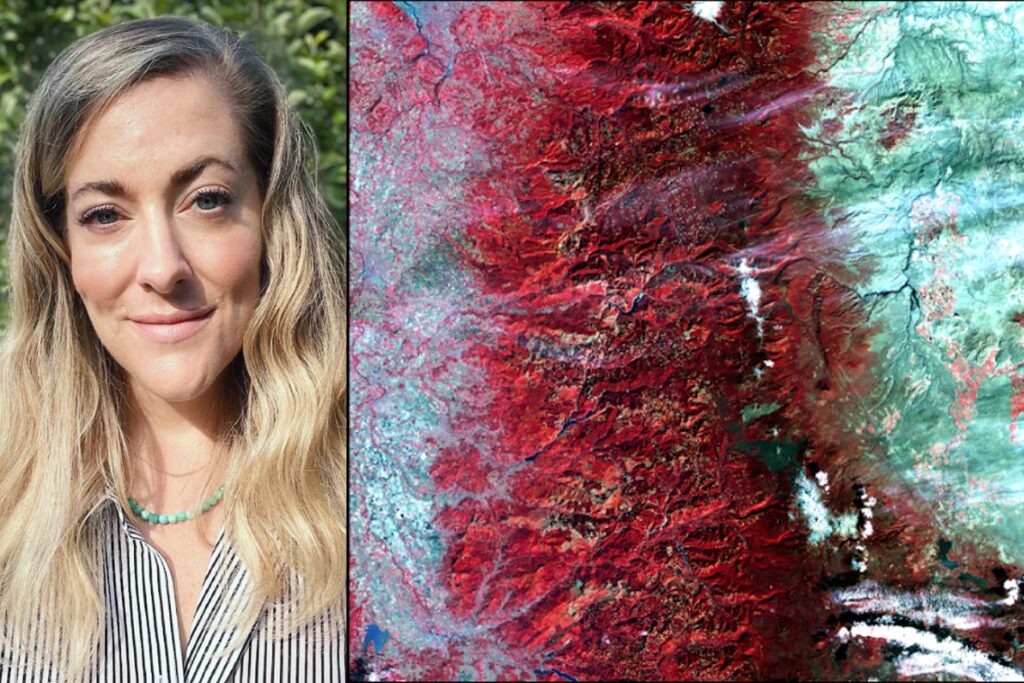
What’s one Landsat image that is significant to you, and why?
This is a Landsat 1 false-color image of Oregon, from October 1972. It stretches from the Willamette Valley (dotted in blues and reds of agriculture), through the densely forested Cascade Mountain Range, and then to the bright, high desert in the east.
Taken less than three months after Landsat 1’s launch, this is not only one of the first sets of Landsat images ever taken over Oregon, where I grew up, but it also represents an important marker in U.S. water history.
This Landsat image was taken in the same month that The Clean Water Act went into effect in the U.S. in 1972. Since then, aquatic ecosystems, like the beautiful Willamette River and its surrounding floodplain wetlands and reservoirs seen in the left side of this image, are now monitored and protected under federal law.
I also love this image because you can view the contrasting landscape features of Oregon shaped by climate, geology, and humans. The clouds present throughout are also a reminder of the precipitation that the Pacific Northwest is so well known for.


