
“The Landsat series of satellites is a cornerstone of our Earth observing capability. The world relies on Landsat data to detect and measure land cover/land use change, the health of ecosystems, and water availability,” NASA Administrator Charles Bolden told the Subcommittee on Space Committee on Science, Space and Technology U.S House of Representatives in April 2015.
“Landsat 9 [will] propel the program past 50 years of collecting global land cover data,” said Jeffrey Masek, Landsat 9 Project Scientist at Goddard. “That’s the hallmark of Landsat: the longer the satellites view the Earth, the more phenomena you can observe and understand. We see changing areas of irrigated agriculture worldwide, systemic conversion of forest to pasture – activities where either human pressures or natural environmental pressures are causing the shifts in land use over decades.”
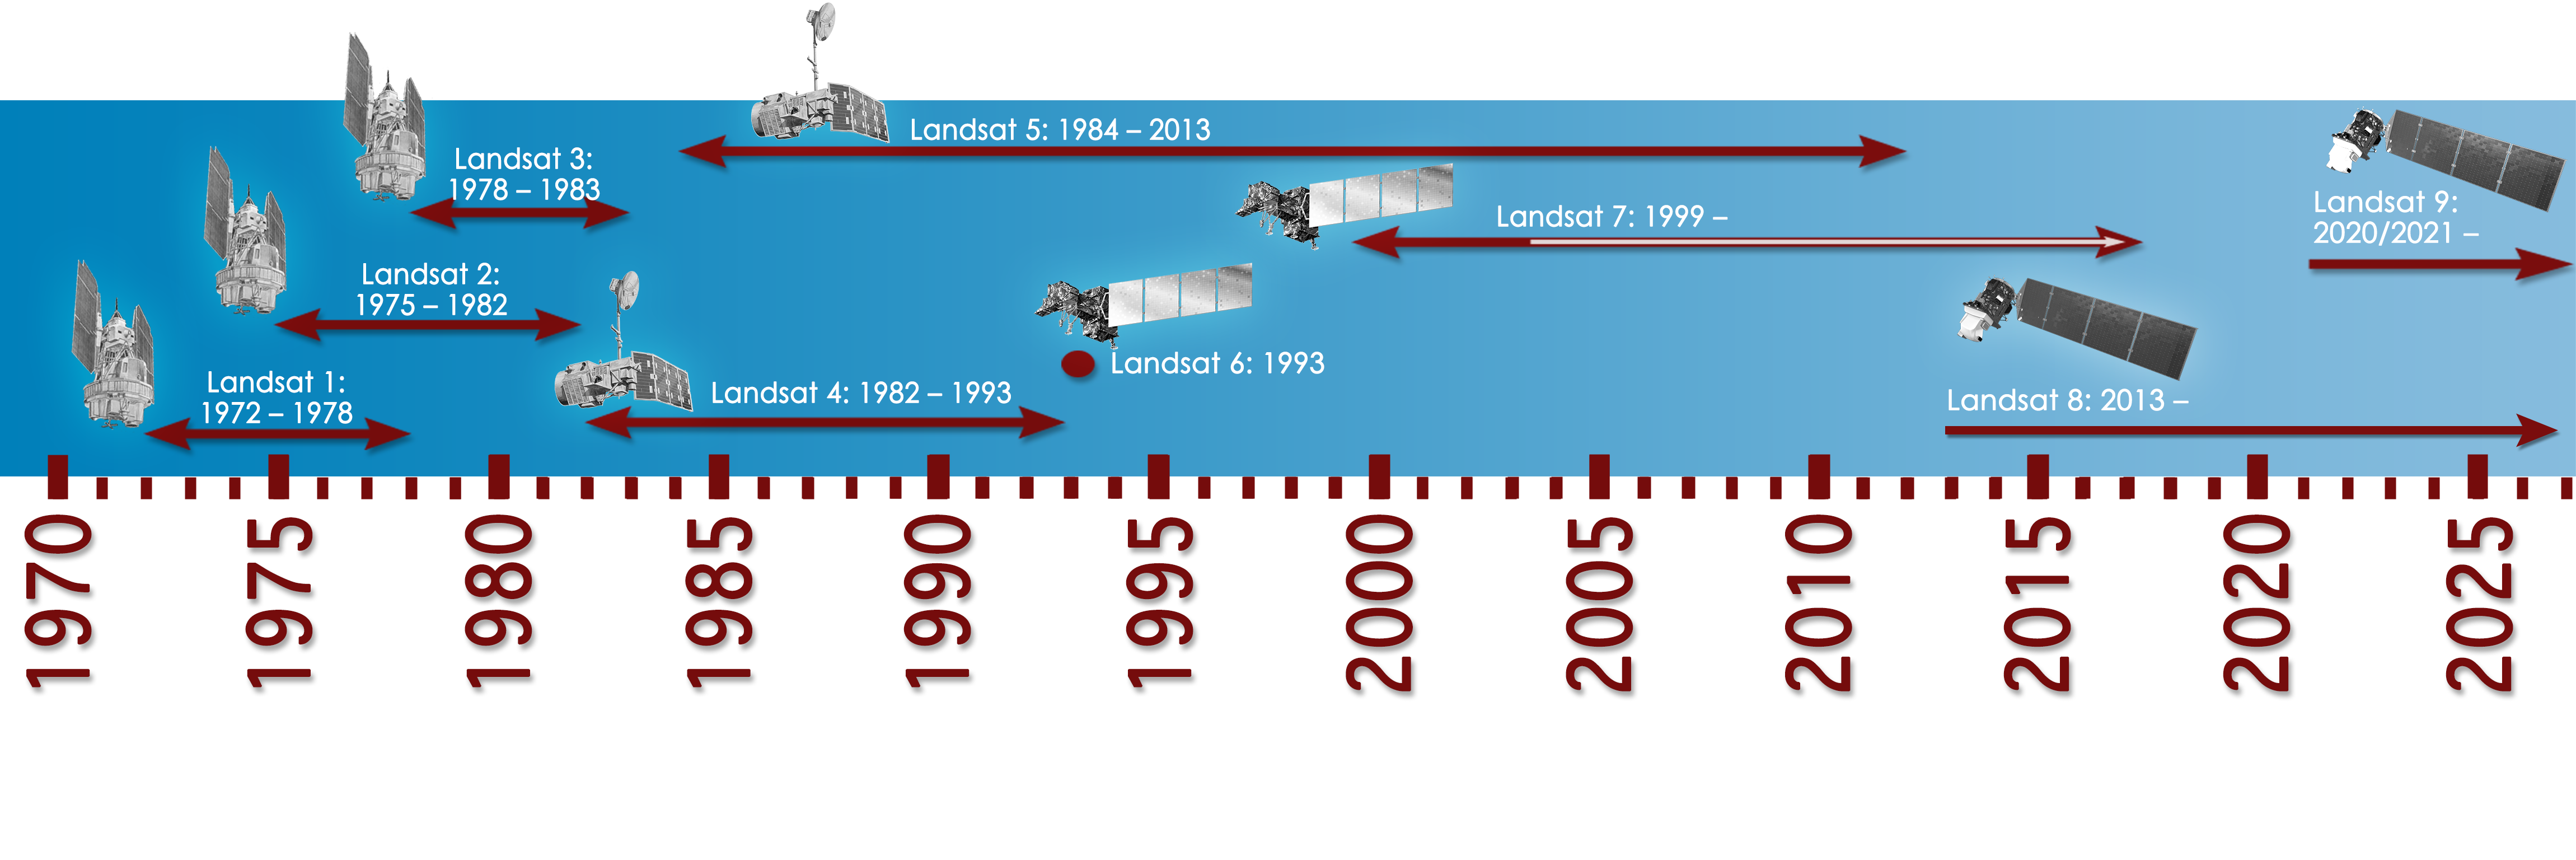
Landsat 9 was announced on Apr. 16, 2015.
Landsat 8 successfully launched on Feb. 11, 2013 and the Landsat data archive continues to expand.
The small white arrow within the Landsat 7 arrow on this timeline indicates the collection of data without the Scan Line Corrector.
Remarkably, Landsat 5 delivered high-quality, global data of Earth’s land surface for 28 years and 10 months, officially setting a new Guinness World Record title for “Longest-operating Earth observation satellite.” Anne Castle, former Department of the Interior Assistant Secretary for Water and Science said in a press release about Landsat 5: “This is the end of an era for a remarkable satellite, and the fact that it flew for almost three decades is a testament to the NASA engineers who launched it and the USGS team who kept it flying well beyond its expected lifetime.”
A closer look at Landsat through time
Spectral Characterization
The measured wavelength locations of the ETM+ spectral bands are compared to Landat 5’s TM in Table 8.1 The spectral bandwidths are determined by the combined response of all optical
