
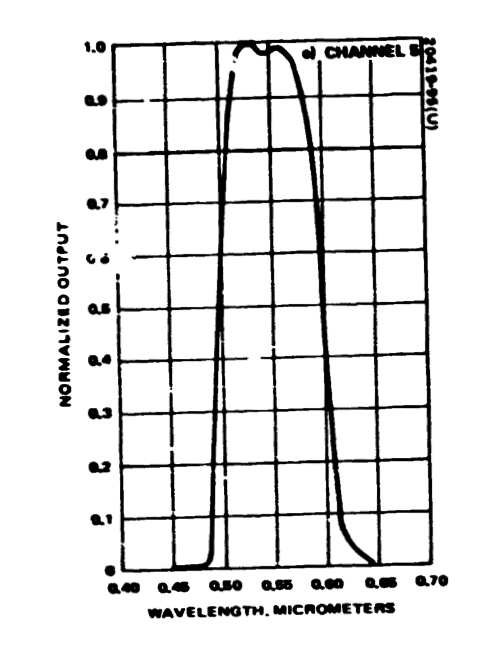
The band-average relative spectral radiance responses of the Landsat-1 through -5 Multispectral Scanner System (MSS) instruments are provided below as extracted from the best reproductions of the original data available. The original measurement data has been lost to history and the only remaining source of the relative spectral responses (RSR) are plots embedded in contractor reports. There were many challenges to recovering the RSR data: the quality of the copies is not particularly good, and plots are relatively small and without many grid lines to aid in digitizing (Figure 1).
Still, the effort was made by South Dakota State University (SDSU) to recover the response curves that weren’t available and make them available publicly.
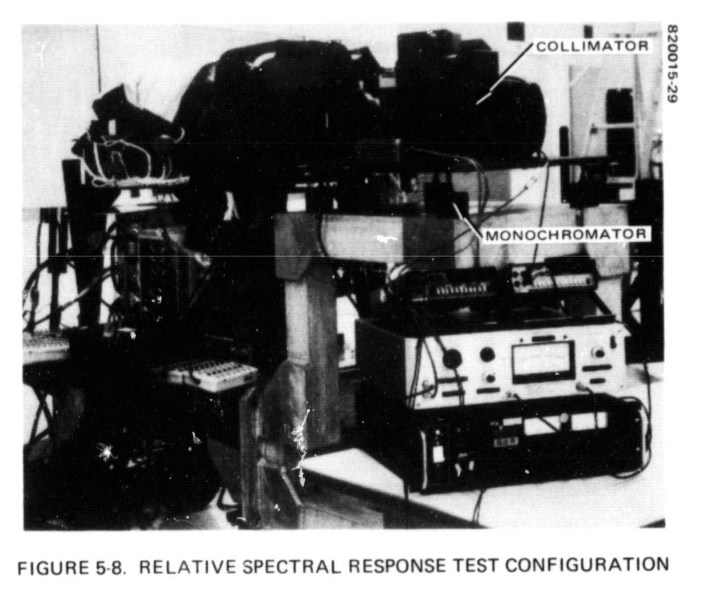
Many of the details of the spectral test are also lost, though there are short descriptions in the contractor reports for each instrument. The RSR of each MSS instrument was measured at the instrument level in ambient temperature. A monochromator was used to feed a collimator in front of the entrance aperture of the MSS. For Landsat-4 and -5 MSS testing, the monochromator stepped through the band passes at 10nm increments (there is no record of the spectral sampling for the earlier instruments). A photo of the test setup for Landsat-4 MSS is shown in Figure 2, as extracted from the final report. At least Landsat-5 MSS RSR was tested as several different temperatures to confirm the presence of a temperature sensitivity, but the data provided here are likely the RSR from the ambient measurements.
A concerted effort was made to digitize and tabularize the plotted data for Landsat-1 through -3 by SDSU. The plots were digitized in May 2008 using FindGraph version 1.911. The data were sampled at 1nm steps and it is estimated that there is +/- 3nm uncertainty on the wavelength samples. Each of the six detectors RSR per band was digitized separately and the band-average normalized result is presented in the spreadsheets.
Tabular data for Landsat-4 and -5 MSS are available in Markham and Barker, 1983. These data were also extracted from contractor report plots, but were digitized from considerably better copies and at the tests’ native spectral sampling (10nm for Bands 1-3, 20nm for Band 4). The response for Band 4 did not fall to zero by the end of the published plot range (1100nm), so the response was extrapolated to a value close to zero at 1140nm. The band-average normalized results are presented in the spreadsheets.
- Landsat1MSS_BandAverageRSR.xlsx
- Landsat2MSS_BandAverageRSR.xlsx
- Landsat3MSS_BandAverageRSR.xlsx
- Landsat4MSS_BandAverageRSR.xlsx
- Landsat5MSS_BandAverageRSR.xlsx
References:
South Dakota State University Image Processing Lab
Markham, B.L., Barker, J.L. (1983). “Spectral characterization of the Landsat-4 MSS sensors.” Photogrammetric Engineering and Remote Sensing, pp. 811-833.
