Search
Close this search box.

April 27, 2011–Five Years Later: A Satellite Imagery Perspective

April 27, 2011–Five Years Later: A Satellite Imagery Perspective

tornado destruction
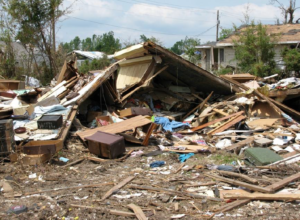
A destroyed wood frame house in Concord, AL caused by a tornado on April 27, 2011. Photo credit: Gary Woodall,, NWS
[by Jordan Bell, NASA SPoRT blog] On April 27, 2011, a severe weather outbreak occurred across the southeastern United States, resulting in 199 tornadoes across the region and over 300 fatalities (NWS 2011 Service Assessment).  Alabama was among the states hardest hit, with 68 tornadoes surveyed by the National Weather Service (NWS) Weather Forecast Offices (WFOs) in Huntsville, Birmingham, and Mobile, Alabama, and over 250 reported fatalities in the state. Huntsville, home to NASA’s Marshall Space Flight Center and the Short-term Prediction Research and Transition (SPoRT) Center, lost power along with most of Madison County after tornadoes severed major utility lines.  The power outage lasted well over a week in some areas. Once power was restored, SPoRT team members were able to provide satellite imagery to our partners in the National Weather Service to help clarify some of the high-intensity tornado damage tracks that occurred throughout the state. SPoRT provided pre- and post-event difference imagery at 250 m spatial resolution from the Moderate Resolution Imaging Spectroradiometer (MODIS) and 15 m false color composites from the Advanced Spaceborne Thermal Emission and Reflection Radiometer (ASTER). These surveys helped our NWS partners confirm their ground surveys, but also helped to correct the characteristics of several tracks (Molthan et al. 2011). Many of these products remain available through the SPoRT web page (link) and also through the USGS Earth Explorer portal (link).
Follow-on studies examined the capability of various NASA sensors for detecting and measuring the length and width of scars visible when using the Normalized Difference Vegetation Index, or NDVI, a measurement of vegetation greenness and health commonly derived from multiple satellite imaging platforms.  SPoRT examined NDVI products from MODIS (250 m), Landsat-7 Enhanced Thematic Mapper Plus (ETM+, 30m) and ASTER (15 m) collected in May and June 2011. Possible tornado tracks were identified, mapped, and were then measured to compare against the official NWS damage surveys.  In general, many of the major tornadoes (defined here with maximum intensity EF-3 and greater) were at least partially visible at resolutions of 15-250 m, though weaker tornadoes or those that occurred in complex terrain were more difficult to detect using NDVI and a single snapshot in time. As tornadoes initiated and increased in intensity, or dissipated and decreased in intensity, some of their characteristics became more difficult to detect.  However, some weaker tornadoes were also apparent in Landsat-7 imagery (30 m) in well-vegetated areas.  A summary of the study is available as a publication in the National Weather Association’s Journal of Operational Meteorology. In 2013, SPoRT received support from NASA’s Applied Sciences: Disasters program to partner with the NWS and facilitate the delivery of satellite imagery to their Damage Assessment Toolkit (DAT).  The DAT is used by the NWS to obtain storm survey information while in the field. Satellite imagery from NASA, NOAA, and commercial sensors (acquired in collaboration with USGS and the Hazards Data Distribution System) helps to supplement the survey process by providing an additional perspective of suspected damage areas.
Many of the damage scars apparent from the April 27, 2011 outbreak exhibited signs of recovery and change in the years following the outbreak.  Other tornado events also brought additional vegetation damage and scarring to the region. With five years passing since the 27 April 2011 tornado outbreak, annual views of cloud-free imagery have been obtained from the Landsat missions, operated and managed as a collaboration between the USGS and NASA.  In the viewer linked below, SPoRT has collaborated with the USGS Earth Resources Observation Systems (EROS) Data Center to acquire 30 m true color and vegetation index information from Landsat 5, Landsat 7, and Landsat 8 during the late spring and summer months when local vegetation is at its greenest, allowing the greatest contrast between damaged and undamaged areas. Users can take a look at these images in a web viewer that allows toggling between different products and years, view some of the tornado tracks surveyed by the NWS following the April 27, 2011 event, and zoom into areas of interest to examine how some of the affected areas have evolved over time:
animation of tornado damage in « Comparison of Quality Flags for NUCAPS Gridded Products April 27, 2011–Five Years Later: A Satellite Imagery Perspective April 26, 2016 by jrbell1 On April 27, 2011, a severe weather outbreak occurred across the southeastern United States, resulting in 199 tornadoes across the region and over 300 fatalities (NWS 2011 Service Assessment).  Alabama was among the states hardest hit, with 68 tornadoes surveyed by the National Weather Service (NWS) Weather Forecast Offices (WFOs) in Huntsville, Birmingham, and Mobile, Alabama, and over 250 reported fatalities in the state. Huntsville, home to NASA’s Marshall Space Flight Center and the Short-term Prediction Research and Transition (SPoRT) Center, lost power along with most of Madison County after tornadoes severed major utility lines.  The power outage lasted well over a week in some areas. Once power was restored, SPoRT team members were able to provide satellite imagery to our partners in the National Weather Service to help clarify some of the high-intensity tornado damage tracks that occurred throughout the state. SPoRT provided pre- and post-event difference imagery at 250 m spatial resolution from the Moderate Resolution Imaging Spectroradiometer (MODIS) and 15 m false color composites from the Advanced Spaceborne Thermal Emission and Reflection Radiometer (ASTER). These surveys helped our NWS partners confirm their ground surveys, but also helped to correct the characteristics of several tracks (Molthan et al. 2011). Many of these products remain available through the SPoRT web page (link) and also through the USGS Earth Explorer portal (link).  CDnGGwIWIAA0MUP The MODIS Band 1 difference image above shows some of the scars left behind by the April 27, 2011 tornado outbreak. Radar snapshots were taken from various times to identify the supercell thunderstorms associated with each track.  Reproduced from Molthan et al. 2011. Follow-on studies examined the capability of various NASA sensors for detecting and measuring the length and width of scars visible when using the Normalized Difference Vegetation Index, or NDVI, a measurement of vegetation greenness and health commonly derived from multiple satellite imaging platforms.  SPoRT examined NDVI products from MODIS (250 m), Landsat-7 Enhanced Thematic Mapper Plus (ETM+, 30m) and ASTER (15 m) collected in May and June 2011. Possible tornado tracks were identified, mapped, and were then measured to compare against the official NWS damage surveys.  In general, many of the major tornadoes (defined here with maximum intensity EF-3 and greater) were at least partially visible at resolutions of 15-250 m, though weaker tornadoes or those that occurred in complex terrain were more difficult to detect using NDVI and a single snapshot in time. As tornadoes initiated and increased in intensity, or dissipated and decreased in intensity, some of their characteristics became more difficult to detect.  However, some weaker tornadoes were also apparent in Landsat-7 imagery (30 m) in well-vegetated areas.  A summary of the study is available as a publication in the National Weather Association’s Journal of Operational Meteorology. In 2013, SPoRT received support from NASA’s Applied Sciences: Disasters program to partner with the NWS and facilitate the delivery of satellite imagery to their Damage Assessment Toolkit (DAT).  The DAT is used by the NWS to obtain storm survey information while in the field. Satellite imagery from NASA, NOAA, and commercial sensors (acquired in collaboration with USGS and the Hazards Data Distribution System) helps to supplement the survey process by providing an additional perspective of suspected damage areas.  Many of the damage scars apparent from the April 27, 2011 outbreak exhibited signs of recovery and change in the years following the outbreak.  Other tornado events also brought additional vegetation damage and scarring to the region. With five years passing since the 27 April 2011 tornado outbreak, annual views of cloud-free imagery have been obtained from the Landsat missions, operated and managed as a collaboration between the USGS and NASA.  In the viewer linked below, SPoRT has collaborated with the USGS Earth Resources Observation Systems (EROS) Data Center to acquire 30 m true color and vegetation index information from Landsat 5, Landsat 7, and Landsat 8 during the late spring and summer months when local vegetation is at its greenest, allowing the greatest contrast between damaged and undamaged areas. Users can take a look at these images in a web viewer that allows toggling between different products and years, view some of the tornado tracks surveyed by the NWS following the April 27, 2011 event, and zoom into areas of interest to examine how some of the affected areas have evolved over time:  Tuscaloosa, AL
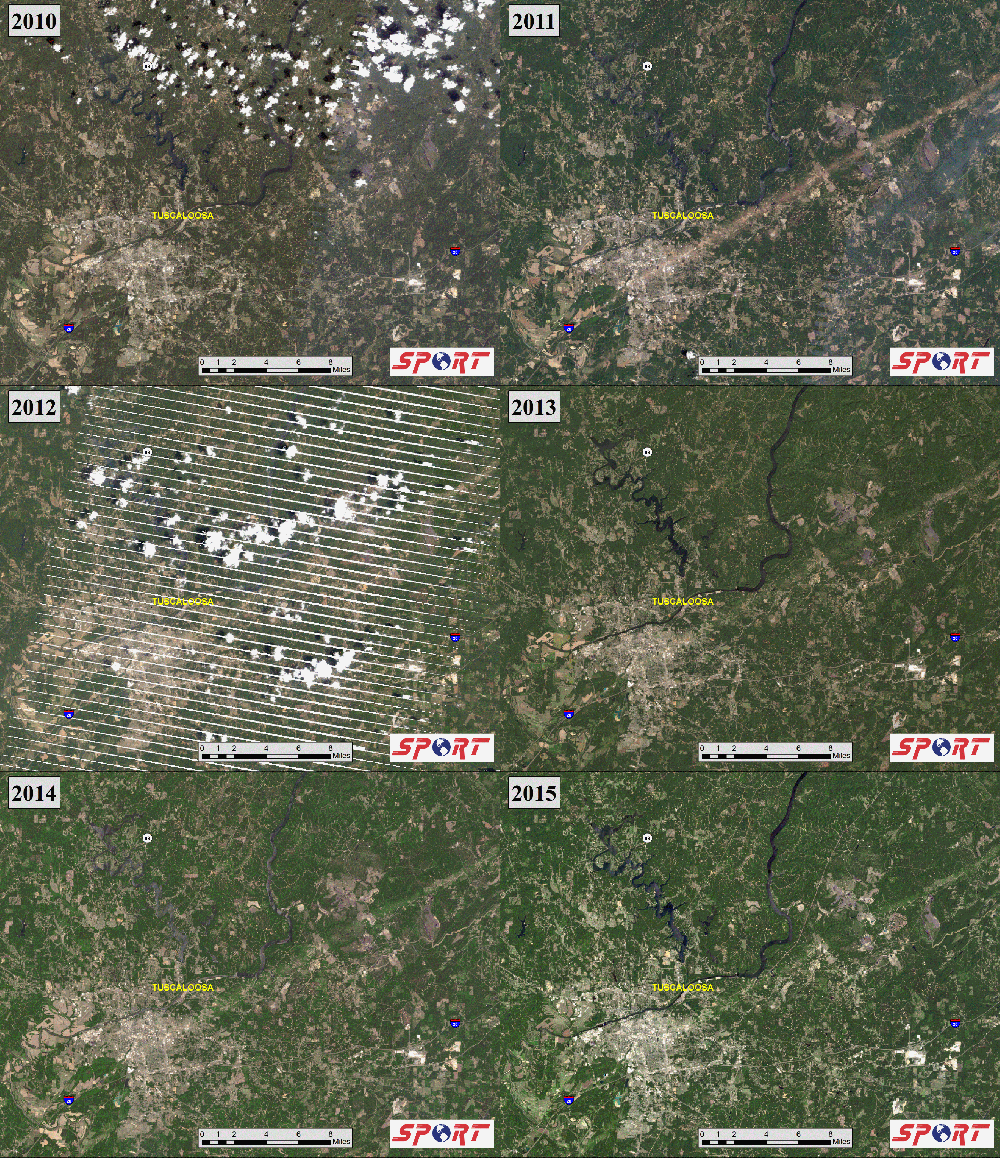
The above animation shows the year before and years after the EF-4 tornado impacted the Tuscaloosa area. The tornado track has seen a significant recovery, but a scar still remains in 2015. In addition to seeing how the landscape as recovered from tornado, development in and around Tuscaloosa is also apparent. Missing pixels in 2012 are due to an issue with the Landsat-7 imager. Image credit: NASA SPoRT

tornado damage near Hackleburg
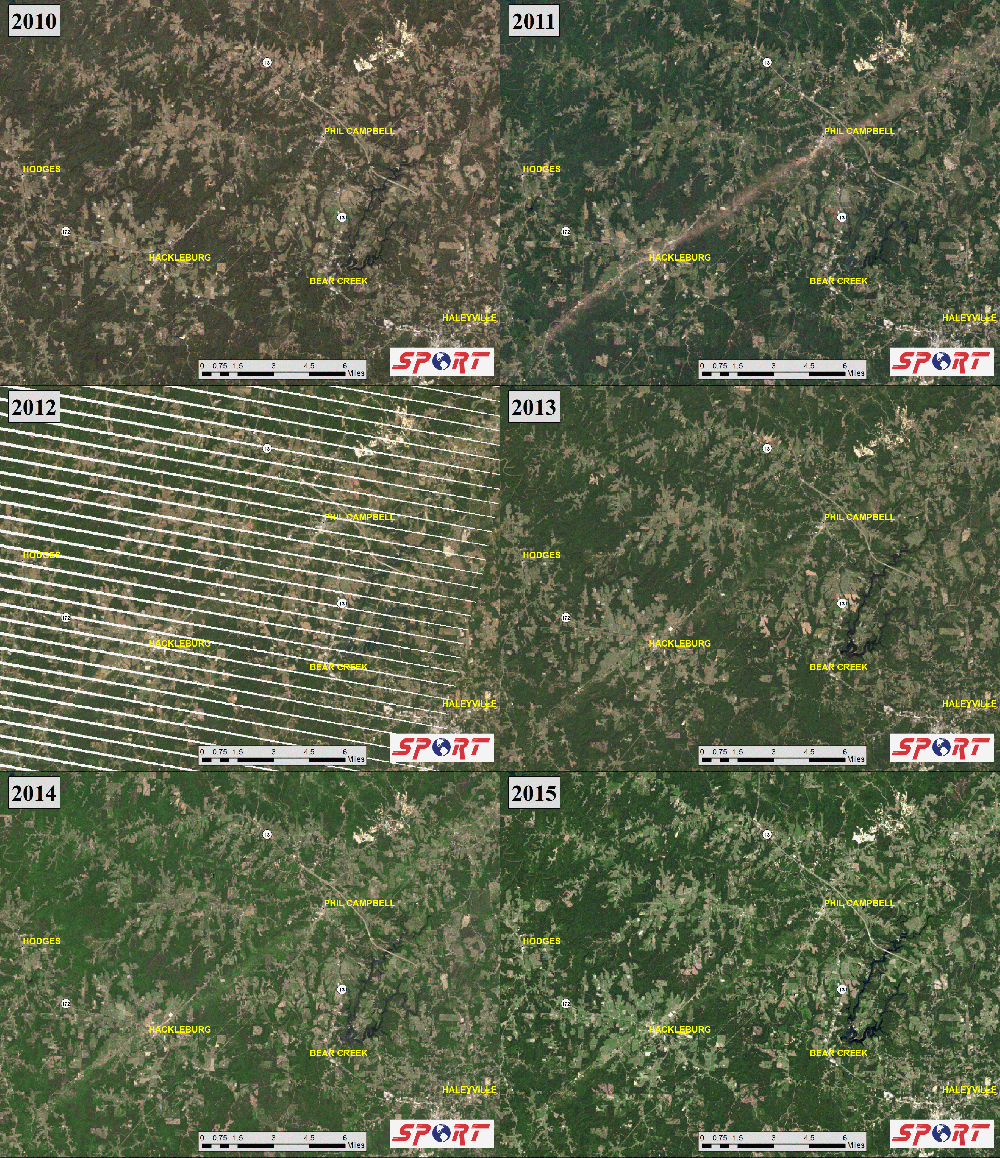
Similar to the Tuscaloosa animation, this animation shows the recovery of the EF-5 tornado that moved through Hackleburg and Phil Campbell, before tracking northeast across the Tennessee River. Missing pixels in 2012 are due to an issue with the Landsat-7 imager. Image credit: NASA SPoRT
On Key

Recent Posts

STELLA Photos

STELLA Spring Webinar: April 15, 2024

STELLA users will talk about their experiences using the DIY spectrometer during this webinar. Panelists include Bianca Cilento (RIT), Karen Karker (SUNY), and Peder Nelson (OSU and NASA GLOBE Observer).

Read More »
On Key

Related Posts

STELLA Photos

STELLA Spring Webinar: April 15, 2024

STELLA users will talk about their experiences using the DIY spectrometer during this webinar. Panelists include Bianca Cilento (RIT), Karen Karker (SUNY), and Peder Nelson (OSU and NASA GLOBE Observer).

Read More »