
Earth observing data help monitor these ecosystem changes. Among the seven pressing concerns covered in this article, Landsat was featured in the case study on North American Forests.
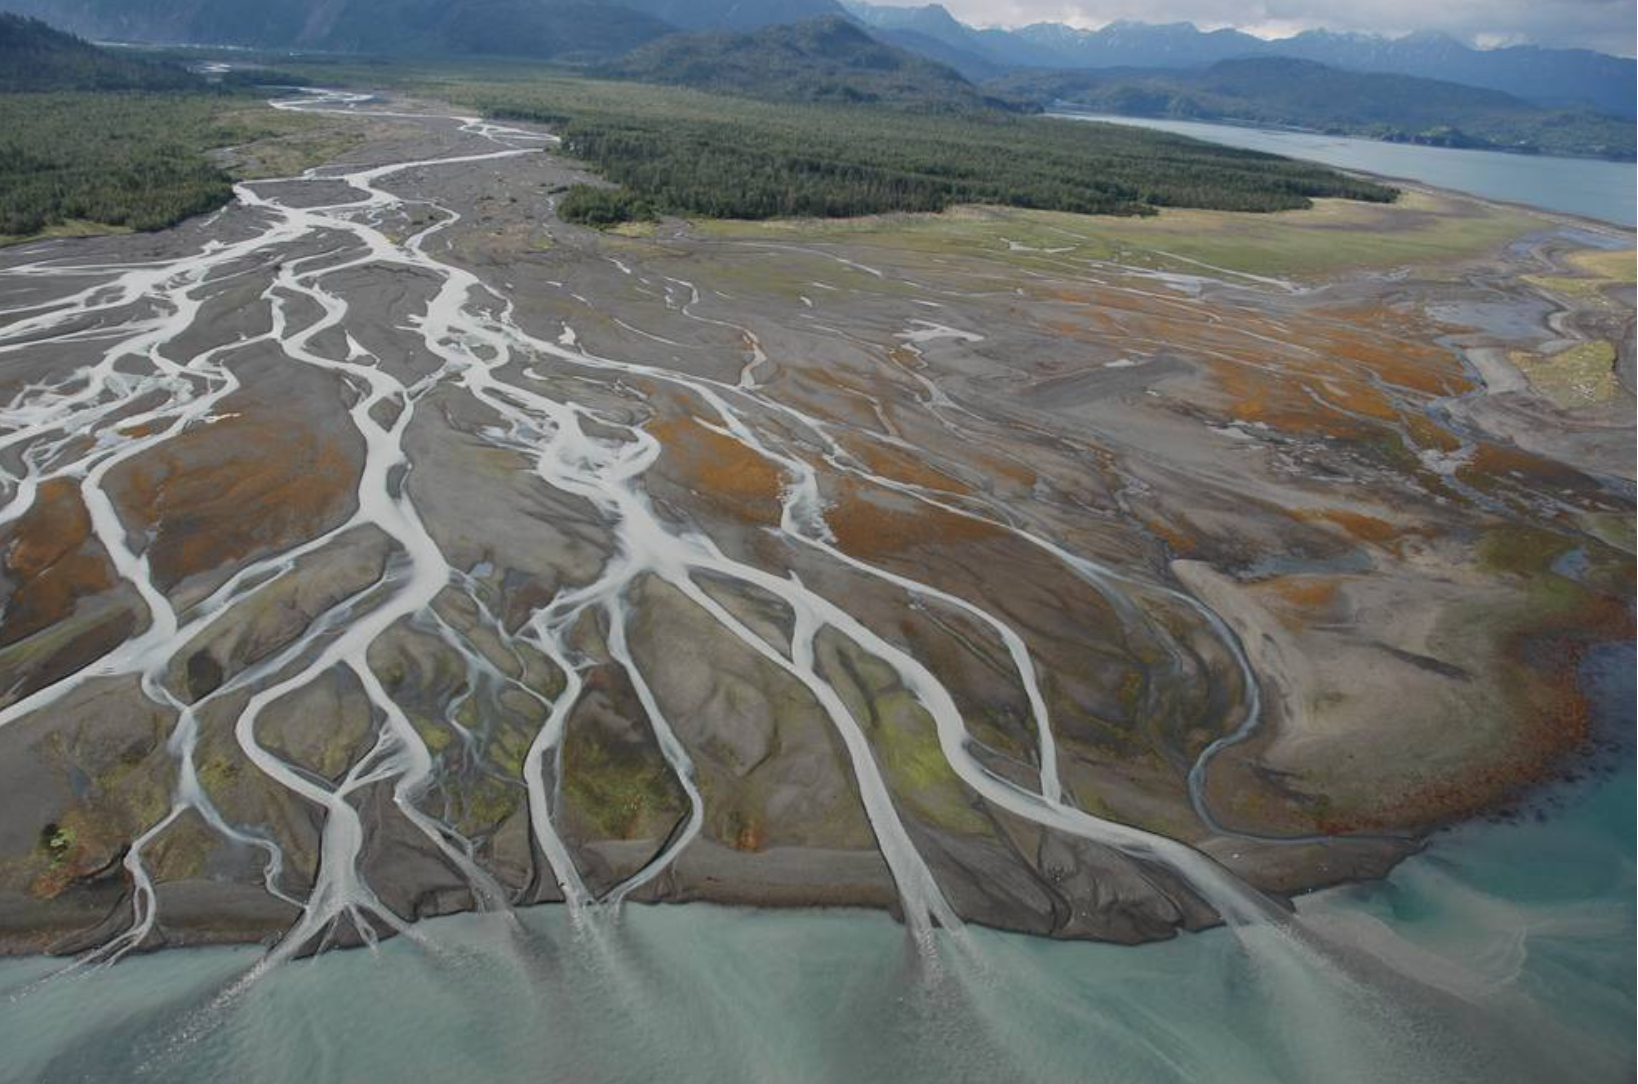
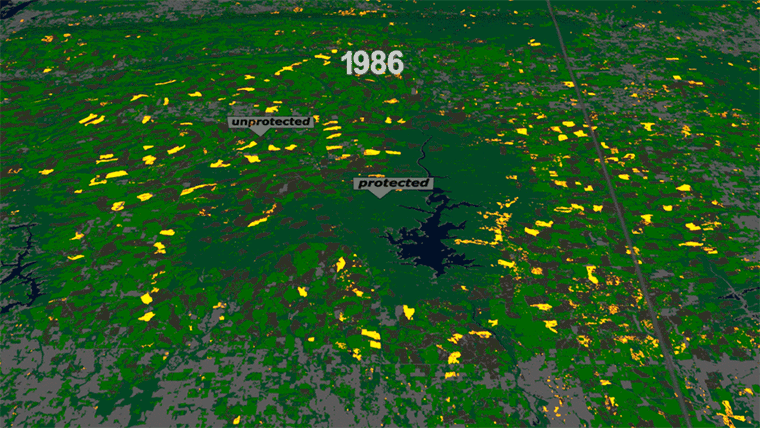
With decades of Landsat satellite imagery at their fingertips, researchers can track changes to North American forests since the mid-1980s. A warming climate is making its presence known.
Through the North American Forest Dynamics project, and a dataset based on Landsat imagery released this earlier this month, researchers can track where tree cover is disappearing through logging, wildfires, windstorms, insect outbreaks, drought, mountaintop mining, and people clearing land for development and agriculture. Equally, they can see where forests are growing back over past logging projects, abandoned croplands and other previously disturbed areas.
“One takeaway from the project is how active U.S. forests are, and how young American forests are,” said Jeff Masek of Goddard, one of the project’s principal investigators along with researchers from the University of Maryland and the U.S. Forest Service. In the Southeast, fast-growing tree farms illustrate a human influence on the forest life cycle. In the West, however, much of the forest disturbance is directly or indirectly tied to climate. Wildfires stretched across more acres in Alaska this year than they have in any other year in the satellite record. Insects and drought have turned green forests brown in the Rocky Mountains. In the Southwest, pinyon-juniper forests have died back due to drought.
Scientists are studying North American forests and the carbon they store with other remote sensing instruments. With radars and lidars, which measure height of vegetation from satellite or airborne platforms, they can calculate how much biomass — the total amount of plant material, like trunks, stems and leaves — these forests contain. Then, models looking at how fast forests are growing or shrinking can calculate carbon uptake and release into the atmosphere. An instrument planned to fly on the International Space Station (ISS), called the Global Ecosystem Dynamics Investigation (GEDI) lidar, will measure tree height from orbit, and a second ISS mission called the Ecosystem Spaceborne Thermal Radiometer Experiment on Space Station (ECOSTRESS) will monitor how forests are using water, an indicator of their carbon uptake during growth. Two other upcoming radar satellite missions (the NASA-ISRO SAR radar, or NISAR, and the European Space Agency’s BIOMASS radar) will provide even more complementary, comprehensive information on vegetation.
The other case studies in this article include: The Arctic, Methane, Tropical Forest, Wildfires, Ocean Carbon Absorption, and Phytoplankton
Read the full article:
+ Seven Case Studies in Carbon and Climate

Be Part of What’s Next: Emerging Applications of Landsat at AGU24
Anyone making innovative use of Landsat data to meet societal needs today and during coming decades is encouraged to submit and abstract for the upcoming “Emerging Science Applications of Landsat” session at AGU24.


