Land cover datasets derived from 1992-93 Landsat TM played a key role in regional atmospheric modeling studies. Joint research by Colorado State University, (CSU), the U.S. Geological Survey (USGS), and NASA has utilized the new USGS National Land Cover Data product to investigate the hypothesis that land cover changes over the past 100 years have influenced weather and climate in south Florida. Our approach involved the use of a pre-1900s natural vegetation scenario and 1990s land use data in the CSU regional atmospheric modeling system (RAMS) to quantify the effects of land use change on summer season rainfall and temperature patterns. For these sensitivity tests, the team reconstructed the pre-1900 land cover from natural vegetation maps which were modified according to early photographs, historical records, and analysis of paleo-vegetation data from sedimentary core samples in the Everglades.
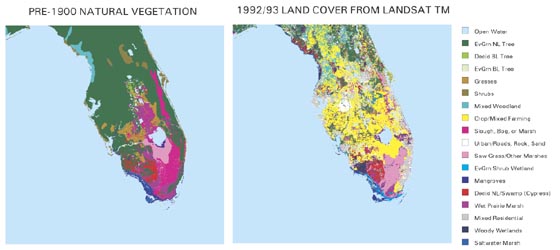
The significant changes in South Florida’s land cover are clearly illustrated in the figure below (Figure 2), which shows the pre-1900s natural vegetation versus 1990s land use. Extensive conversion of the natural landscape from forested areas and wetlands to agriculture and developed urban and suburban areas is evident.
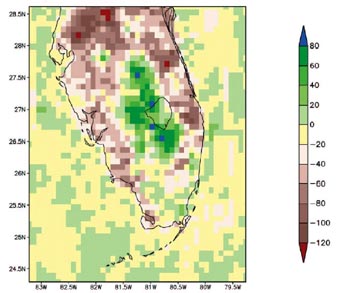
Using the two datasets, we conducted a series of land cover change sensitivity tests to determine the effects of land cover change. The primary results of the study are illustrated above (Figure 1) which shows the modeled precipitation difference field defined as the total Jul.-Aug. accumulated rainfall for the 1990s land use minus the total Jul.-Aug. accumulative rainfall associated with the pre-1900 natural vegetation. Positive differences (shades of green) in Figure 1 indicate higher rainfall totals for the 1990s land use relative to the pre-1900 natural vegetation. Non-green areas represent locations where the simulated rainfall based on the 1990s land use was less than the rainfall for the natural vegetation. Overall the modeling results consistently suggested approximately a 12 percent decrease in July-August rainfall over the entire South Florida region due to land use changes, with some spatial heterogeneity.

Contributors: Curtis Marshall, Roger Pielke Sr., Louis Steyaert, and Debra Willard

Be Part of What’s Next: Emerging Applications of Landsat at AGU24
Anyone making innovative use of Landsat data to meet societal needs today and during coming decades is encouraged to submit and abstract for the upcoming “Emerging Science Applications of Landsat” session at AGU24.


