By Laura E.P. Rocchio
This afternoon at #AGU15, Courtney Reents, a graduate student at University of Illinois at Urbana-Champaign, presented a poster on forest disturbance in California. Here’s a short Q&A on her research.
Presentation title:
Characterization of Forest Disturbance in California using Landsat Spectral Trajectories
What are the major findings of your research?
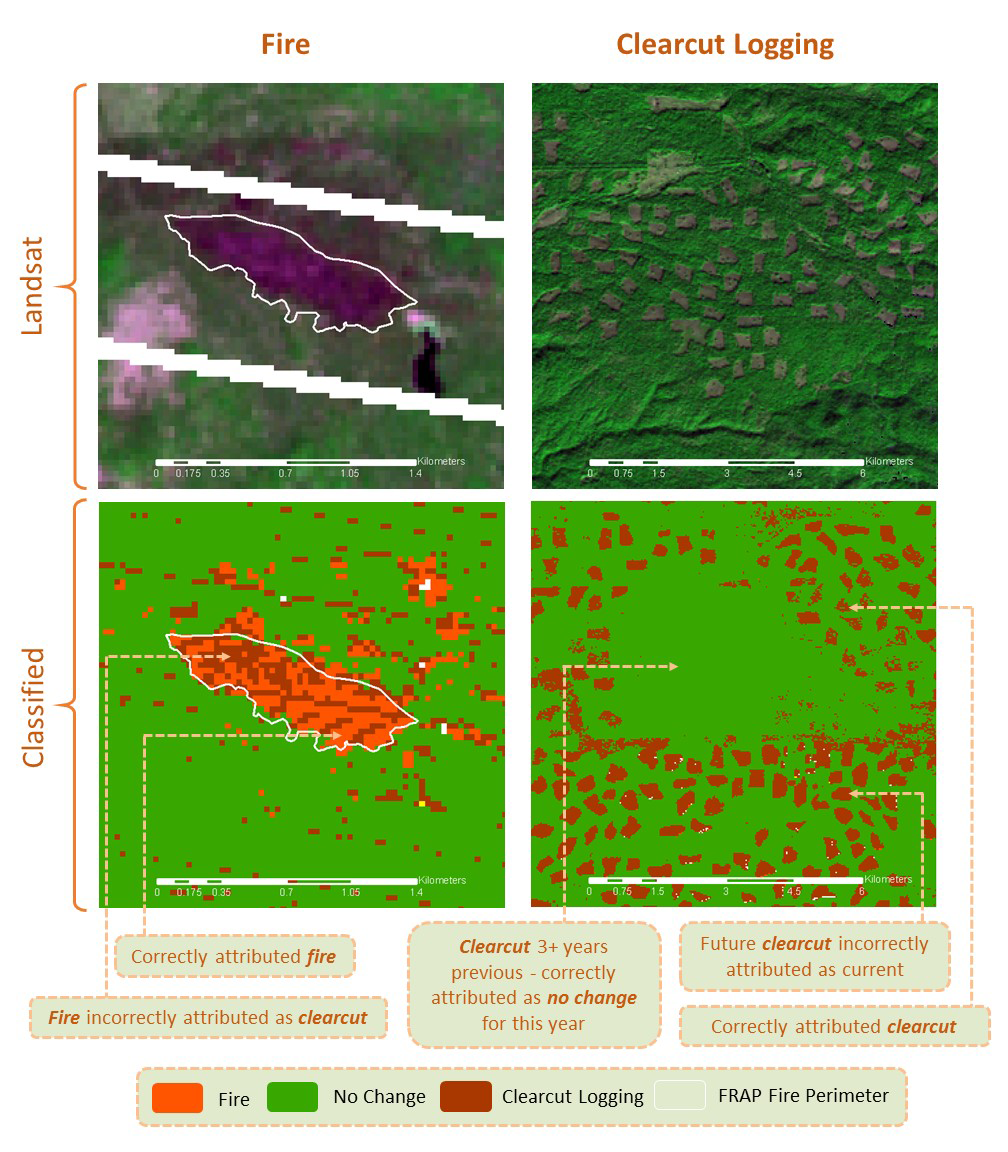
Our research found that sub-annual Landsat time series are extremely effective at detecting the occurrence of forest disturbance and quite good at attributing the cause of the disturbance as well when using classes of fire, pest, urban and agricultural conversion, clearcut logging, and no change. However, we also found certain disturbance classes—such as clearcut logging and urban conversion—to be spectrally similar, making it difficult for our model to differentiate these classes. Finally, our model offered some insight into the variables that proved most important for distinguishing between disturbance agents: the Near Infrared and Shortwave Infrared bands provided the greatest distinction between classes, and spectral values both at the time of the disturbance as well as two to three years before and after offered important information on the temporal patterns demonstrated by different agents.
What insight did you gain from Landsat that would have been impossible to glean otherwise?
The thirty-meter resolution of Landsat and the 16-day return interval are particularly suitable for studying forest disturbance through time because the spatial and temporal scales match well with the ecological scale of the processes being observed. Without the longevity and consistency of the Landsat program, as well as the free availability of the high quality Surface Reflectance Product images, a project of this nature would not have been possible. In downloading approximately thirty thousand images through the course of this project, encompassing the entire state of California over thirty years, I became acutely aware of how prohibitive data costs would have been if we had needed to pay for each image individually. Without access to the full time series of images, the project would not have been able to investigate these disturbances at a sub-annual level, which may have reduced the model’s capacity to determine disturbance cause and would have severely limited the temporal resolution of the final product.
Who will be the main consumers of your data product?
Our hope is that this data product will find an audience in any group or individual interested in understanding the forest disturbance history of any particular locality or region in California. Whether this be researchers modelling carbon dynamics or land managers looking to better understand how an area of interest has changed through time, we hope that this product will offer some insight into forest dynamics at a variety of spatial and temporal scales. In addition, by applying the model to the entirety of California over many years, we believe that the output disturbance maps will provide new information about changing disturbance regimes at the regional scale.
Co-author:
Jonathan Greenberg
University of Illinois at Urbana Champaign
Anyone can freely download Landsat data from the USGS EarthExplorer or LandsatLook.
Further Reading:
+ Landsat at #AGU15