From the petroglyphs of ancient societies to the stunning views of our planet from space, humans have endeavored to visualize and accurately map our world. As early geographers recorded the experiences from travelers and merchants, they created lists of places and geographic features. To spatially represent these data, geographers mapped the distances between features from the perspective of the traveler. Maps have aided navigation, settled disputes, and illustrated the extent of an Empire’s power. Beyond these and other utilitarian uses for maps, the desire to discover what was beyond the edges of the map–to venture into the unknown–brought about an Age of Exploration that continues into the 21st century with space exploration.
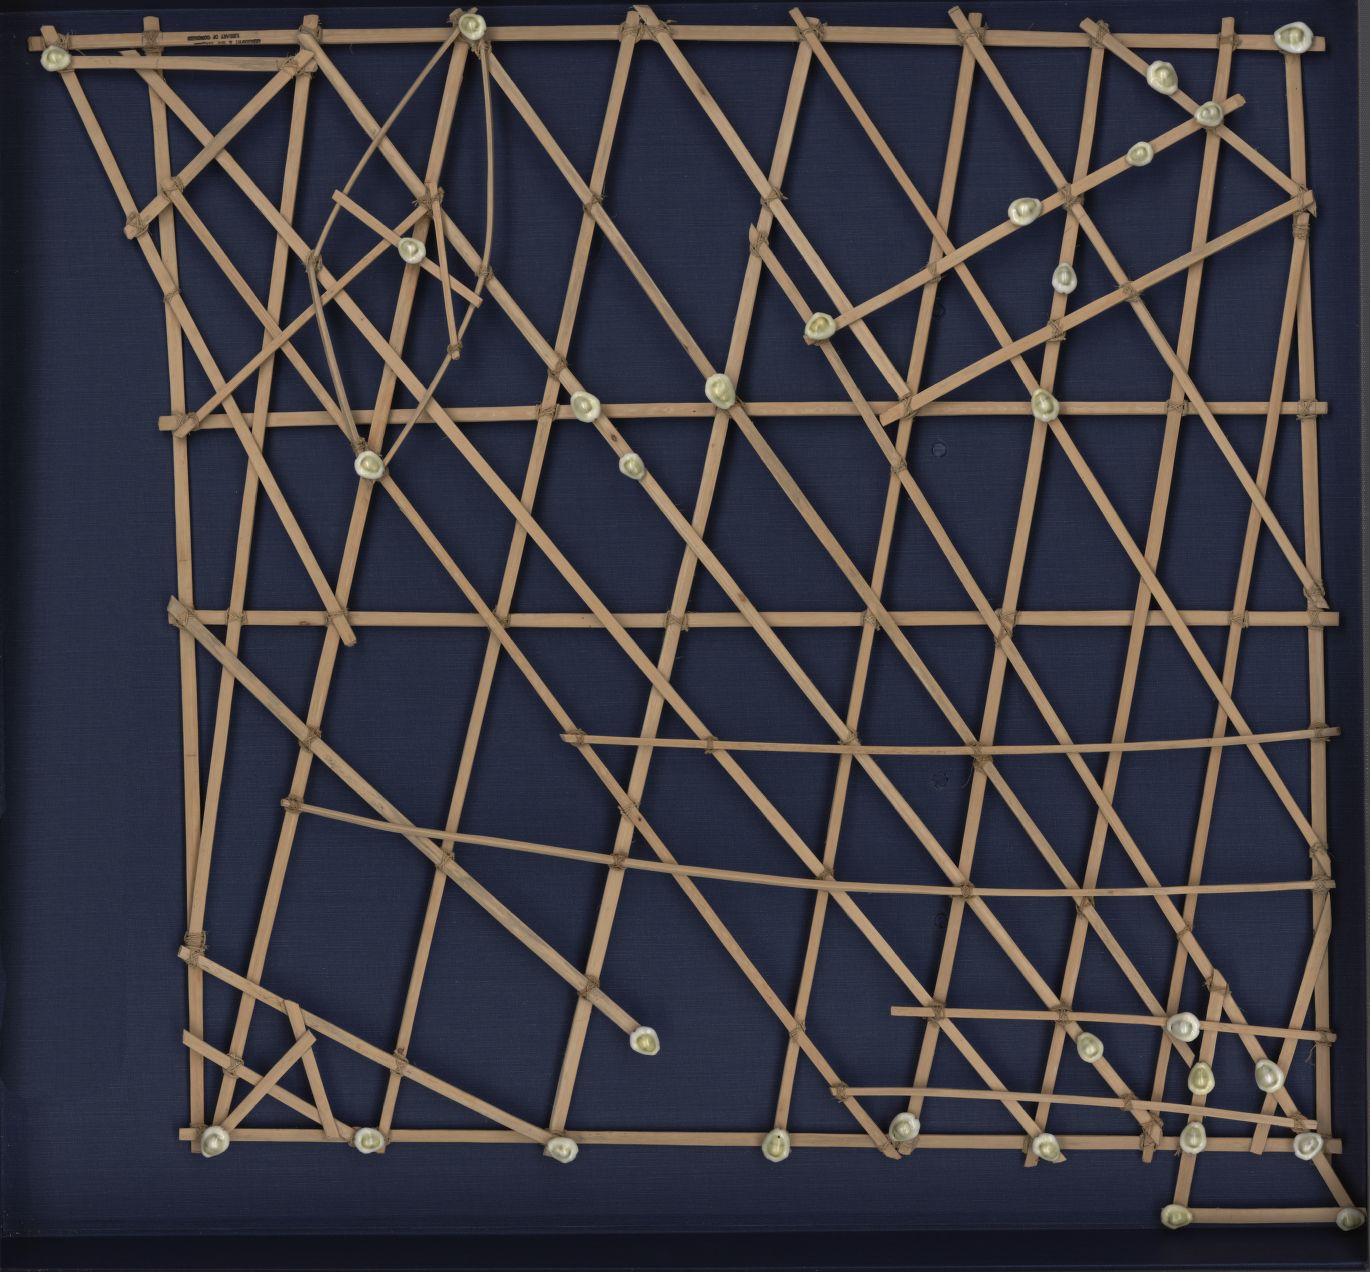
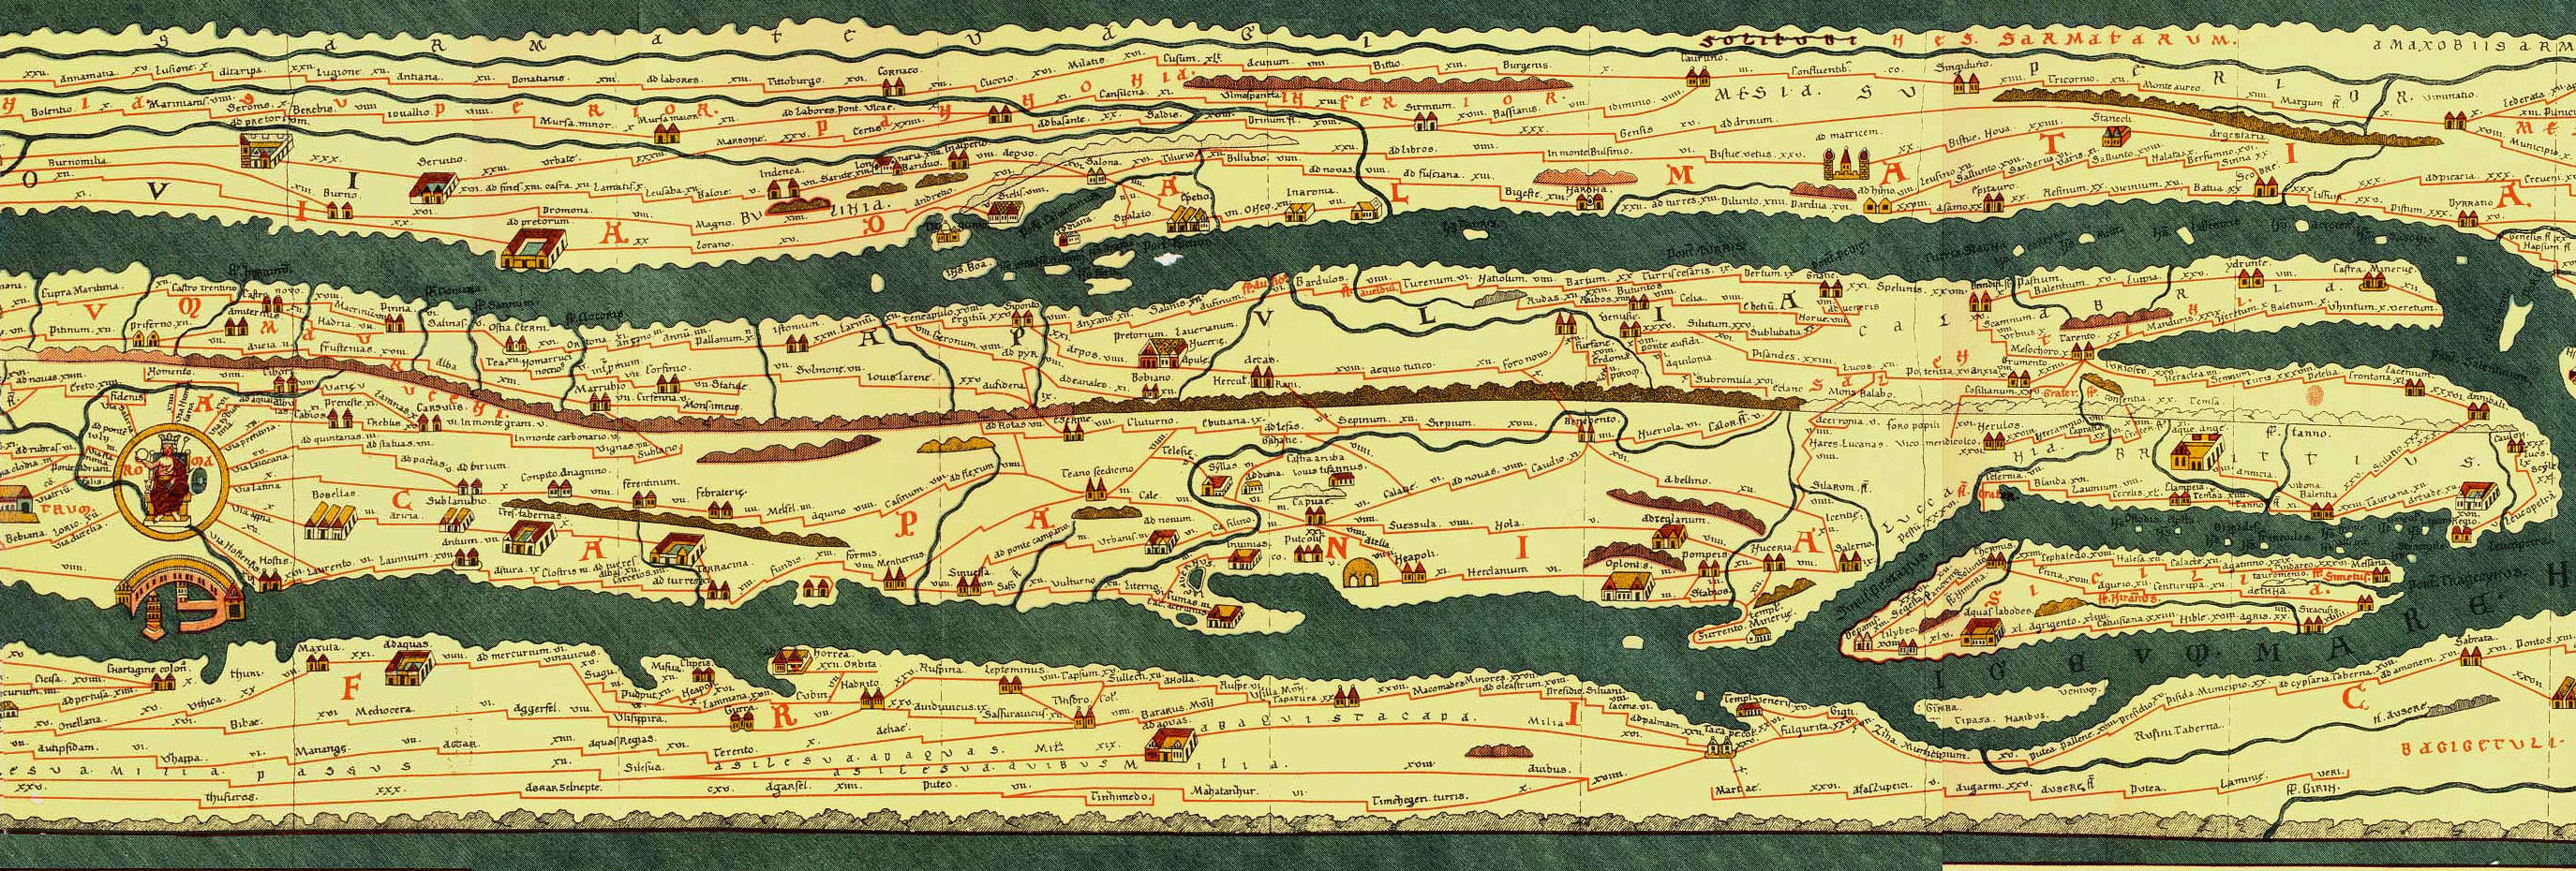
Many early maps were produced to help people navigate. Natives of the Marshall Islands created the so-called ‘stick charts’ to map island groups. The Egyptians mapped the journey to the afterlife; Romans mapped roads to Rome, and Christians mapped their pilgrimage to the Holy Land. Often these maps focused more on a specific need than the quest for accurate geography. The embellishments, narratives, and pictures that made up such maps provide a wealth of information about a society’s history and worldview. The accuracy of early maps, however, was subject to personal accounts and charts from sailors, merchants, and travelers.


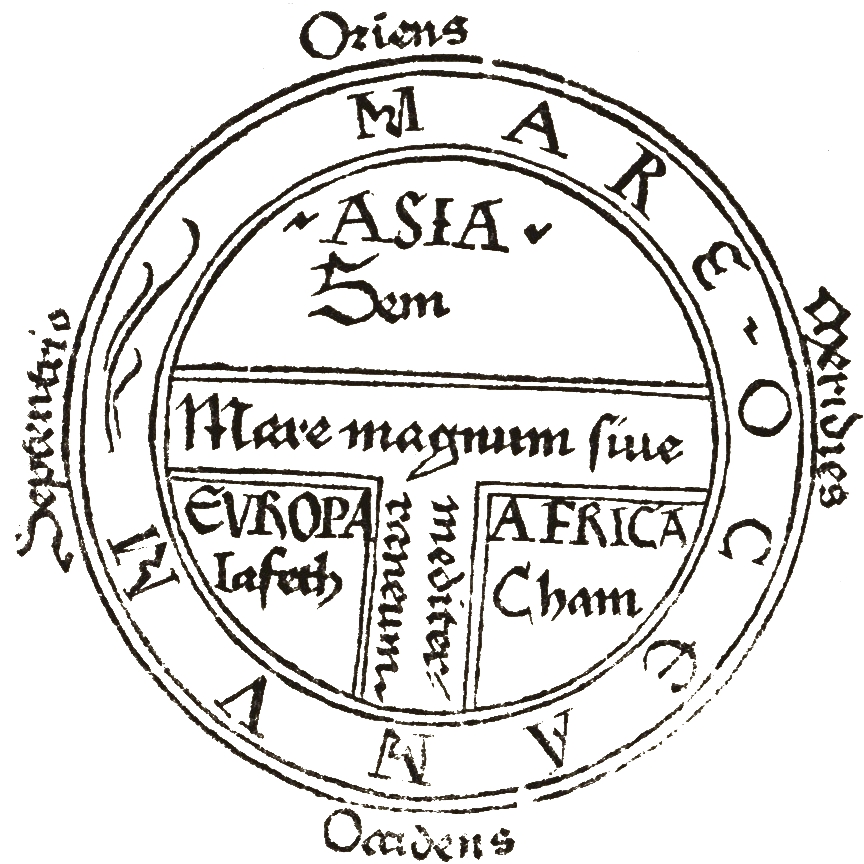
Medieval mappaemundi provide an excellent example of culturally based maps. The concept came from St. Isidore, a bishop from Seville in Spain, who wrote Etymologiae (“origins”), a 20-volume text that contained everything that Europeans knew about the world in the seventh century. He consulted numerous sources from classical writers to the teachings of Christianity to describe the physical geography of the world along with a graphic expression of the known world.
These maps, called mappaemundi– in Latin mappae means cloth and mundi means the world–captured the medieval worldview based more on religion and philosophy than geography. The world was represented as a circular disc of three continents surrounded by the Ocean based on the biblical account that the Earth was divided into three sections, one for each of Noah’s sons. European mappaemundi showed Jerusalem at the center and oriented with the Garden of Eden (east) at the top. This theological depiction of geography would dominate medieval cartography for centuries.
Centuries before these medieval maps, a more scientific view of the world was achieved. Early Greek philosophers and cosmologists began to study the physical nature of our world as early as the sixth century BCE. They approached geography using mathematical and geometrical theories and speculated that the Earth was a sphere. By 150 AD, Ptolemy created Geographia, the most comprehensive account of the world’s geography deduced from Greek and Roman knowledge. Based in science, he used the principles of geometry to create meridians and parallels (latitude and longitude) in an attempt to accurately map the known world even though there were still vast areas of the unknown world–Terra Incognita. Unfortunately, when the temples of Alexandria fell, this knowledge was lost to the western world throughout the Middle Ages.
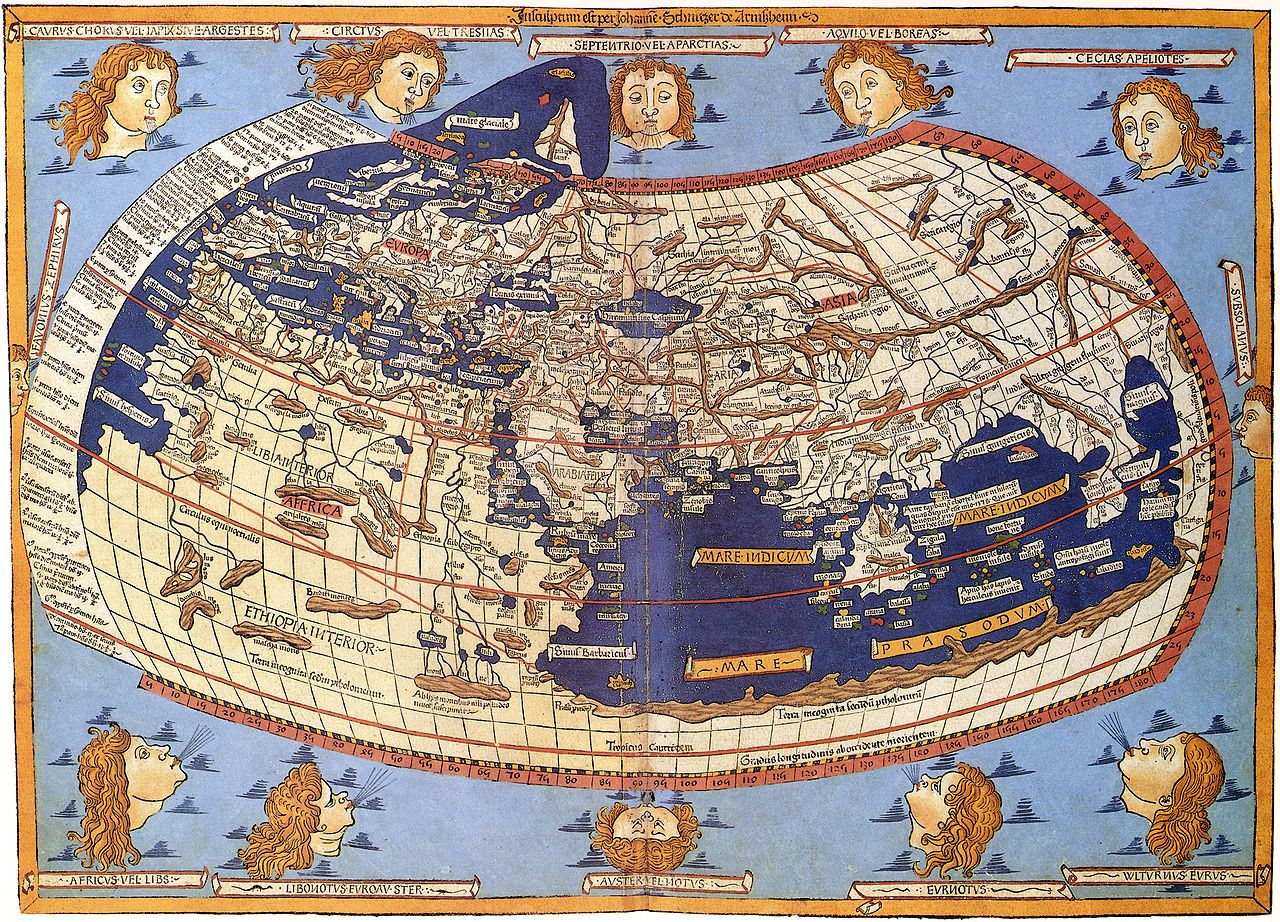
Ptolemy’s Geographia was re-discovered and translated into Arabic the 9th century and reached European geographers by early 15th century when it was translated into Latin. Original maps drafted by Ptolemy have never been found, but his descriptions with latitude and longitude of more than 8,000 locations allowed mapmakers to reconstruct maps of Ptolemy’s view of the world. The resulting maps were dramatically different and a much more accurate depiction of world geography than the mappaemundi of the time. The concept of a global grid system re-established a scientific approach to geography and mapping.
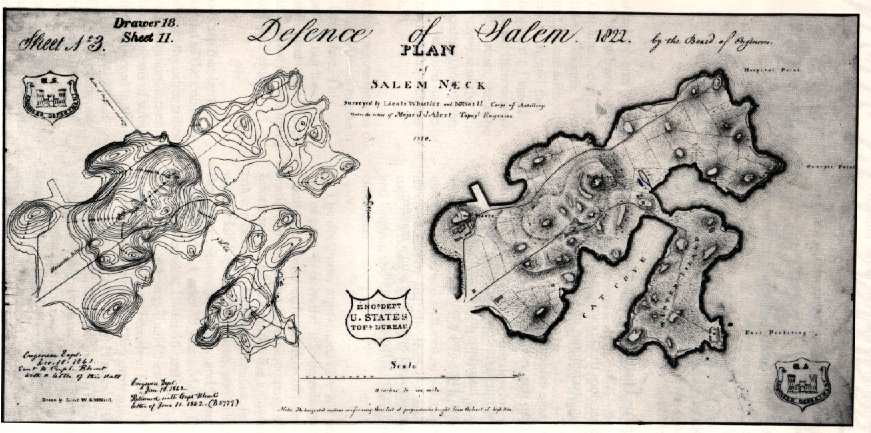
The Age of Exploration (15th and 16th centuries) renewed the quest for accurate geography and the validation of locations. With both the passion of early mapmakers and the advancement of technology, maps became increasingly more accurate, but offered less cultural information. By the late 17th century, Giovanni Domenico Cassini included no place on his map, the “planisphere terrestre,” unless its position was determined astronomically. Employing scientific principles in mapping continued with the huge triangulation surveys of France, Britain, and India. The technology of surveying continued to advance and the mapping coastlines became more accurate as bathymetry was recorded and mapped. Cultural and artistic elements were gradually replaced with scientific elements. For example, artistic shading lines (or hachures) were used to illustrate mountains and other terrain. This practice was replaced with contour lines to provide more accurate topographic maps.

By the 20th century, map-making reached new levels of accuracy. Geographers began to use aerial and satellite imagery to create highly accurate maps and improve maps of previously surveyed areas. Unlike the earliest maps based on culture and stories, satellite-based maps are entirely empirical and impartial. The neutral information that comes from satellites is the base of international agreements that would otherwise not be possible. At the same time, satellite images also tell a story, provide context about a culture, and document changes in the natural world. By studying satellite images over time, researchers can determine the impact of human endeavors on Earth’s landscape. And by contrasting historical maps with satellite images, we can explore our changing worldview and the advances in technology that help us map the world.