
The Social and Economic Analysis team at the Fort Collins Science Center recently added five new agriculture focused case studies to their “Landsat Imagery: A Unique Resource” website.
Summaries and links via the USGS team:
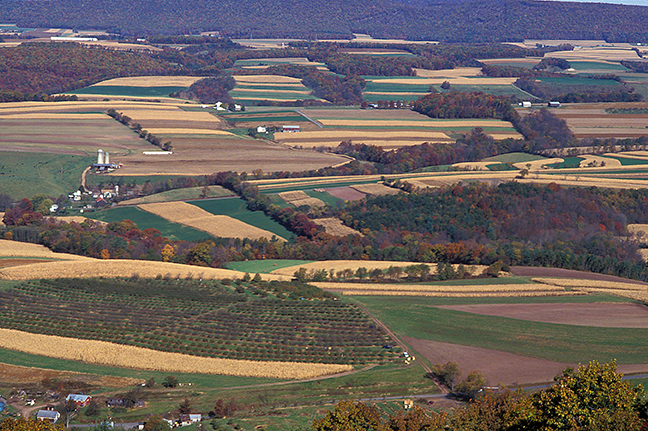
Zone Mapping with Landsat Imagery
Farmers have long known that not all areas in a field produce the same yield, yet the ability to measure and map this variability is a fairly recent arrival in agronomic management. The practice of measuring and mapping yield limiting variables throughout a field is generally referred to as zone mapping (Zhang and others, 2010). Zone maps are used to identify areas within a field that express a similar composition of one or more factors, including soil properties (structure, organic content, depth, and drainage), nutrient levels, topography (flatland, rolling hills), and historic crop growth and yield. A prerequisite to mapping these factors is the ability to accurately and consistently measure them at a high enough resolution to be able to rectify differences at the sub-field level. Multi-spectral sensors such as the Operational Land Imager (OLI) aboard Landsat 8 and the previous generation Enhanced Thematic Mapper Plus (ETM+) aboard Landsat 7 have proved exceptionally capable in this regard. Additionally, both the OLI and ETM+ sensors collect imagery at 30-meter resolution for multispectral bands, which is sufficient for mapping variability at the field level. By utilizing different combinations of bands, it is possible to measure different environmental factors, particularly soil properties and vegetation status.
USDA National Agricultural Statistics Service Cropland Data Layer
The Cropland Data Layer (CDL) is a product of the USDA National Agricultural Statistics Service (NASS) with the mission “to provide timely, accurate and useful statistics in service to U.S. agriculture” (Johnson and Mueller, 2010, p. 1204). The CDL is a crop-specific land cover classification product of more than 100 crop categories grown in the United States. CDLs are derived using a supervised land cover classification of satellite imagery. The supervised classification relies on first manually identifying pixels within certain images, often called training sites, which represent the same crop or land cover type. Using these training sites, a spectral signature is developed for each crop type that is then used by the analysis software to identify all other pixels in the satellite image representing the same crop. Using this method, a new CDL is compiled annually and released to the public a few months after the end of the growing season through the online CropScape data portal.
USDA Foreign Agricultural Service Global Agricultural Monitoring
The Foreign Agricultural Service (FAS) handles USDA international activities, including the monitoring and estimation of crop supply and demand across global markets. Estimates for foreign production, supply, and demand are developed primarily through agricultural attachés. Attachés are based in foreign embassies, primarily in countries representing potential markets for U.S. crops. FAS attachés are further assisted by the International Production Assessment Division (IPAD), which collects and analyzes global crop condition and production. IPAD crop production analysts and FAS Global Agricultural Information Network (GAIN) reports both provide crucial inputs for the monthly World Agricultural Supply and Demand Estimates (WASDE) report.
USDA Estimation of Crop Production
Remote sensing, including Landsat satellite imagery, plays an important role in developing crop production estimates. In particular, the use of satellite imagery plays an important role in enhancing the accuracy and reliability of global crop production estimates (Vogel and Bange, 1999). Domestically, satellite imagery provides supplemental data to annual ground-based agricultural surveys. In addition to supplementing annual estimates, the ability of satellite imagery to provide near real-time production estimates of major crops is increasing, with significant strides occurring within the last decade. The task of estimating crop production is the responsibility of the National Agricultural Statistics Service (NASS) for domestic (U.S.) production and the Foreign Agricultural Service (FAS) for all global production (excluding the U.S.).
Monitoring Consumptive Water Use for Global Crop Production
Monitoring consumptive water use is an important component of global agricultural monitoring (Curt Reynolds, USDA FAS, written commun. and oral commun., 2014), as a majority of global production relies at least in part on irrigation for crop production. Globally, irrigated agriculture supports production of about half of the world’s food supply (Thenkabail and others, 2010). In the United States (U.S.), agriculture accounts for around 80 percent of consumptive water, reaching upwards of 90 percent in many western states (USDA Economic Research Service, 2014).


