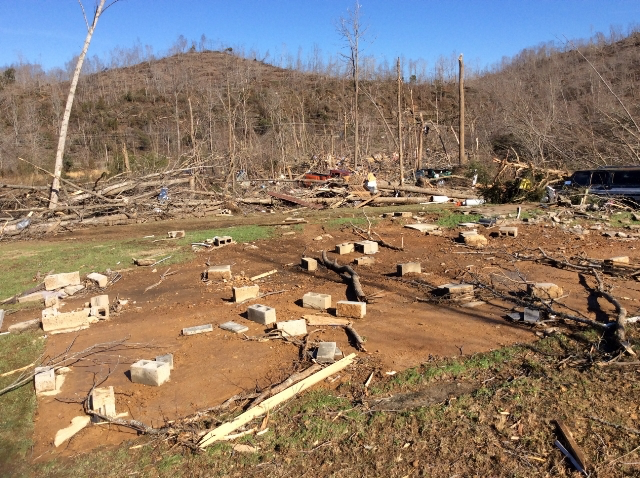
Search
Close this search box.

Landsat Imagery Helps Determine Tornado Tracks

Landsat Imagery Helps Determine Tornado Tracks

tornado damage Perry Co. 2015
Damage from the EF2 tornado that touched down in Perry County, Tennessee on Dec. 23, 2015. Many barns and sheds were destroyed along the tornado’s path and hundreds of trees were uprooted or snapped in half. Sadly, the tornado also caused two fatalities.
Photo credit: NOAA

tornado track
Landsat 8 panchromatic imagery (contrast enhanced) from March 22, 2016 showing the damage swath from an EF2 tornado that killed 2 people southeast of Linden, TN. The beginning point of this tornado was adjusted ~2 miles further southwest than originally estimated based on the satellite imagery. Image credit: NASA SPoRT

[by Sam Shamburger, NASA SPoRT blog] On December 23, 2015, an unusual early winter season tornado outbreak struck much of the Tennessee Valley. Several tornadic supercell thunderstorms developed across northern Mississippi and western Tennessee in the afternoon hours, producing several large long-track tornadoes that unfortunately resulted in numerous fatalities and injuries. These same storms then moved rapidly east-northeastward at up to 70 mph across Middle Tennessee during the evening, spawning 4 tornadoes and causing 2 deaths and 7 injuries. Prior to this tornado outbreak, only 7 tornadoes had ever been recorded across Middle Tennessee since the 1800s, easily making this the largest and worst December tornado outbreak in Middle Tennessee history.
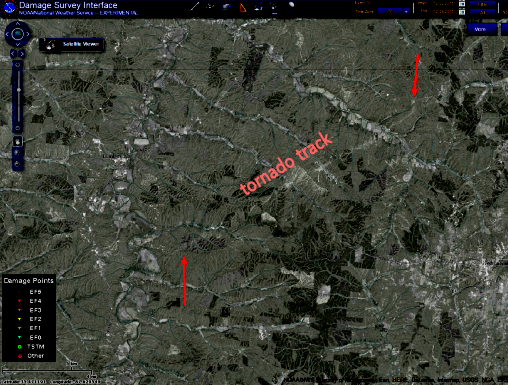
National Weather Service (NWS) Nashville sent out three storm survey teams to evaluate all of the damage from these tornadoes on Christmas Eve and again on Christmas Day. Unfortunately, the affected areas were very rural and mostly inaccessible to the storm survey teams, with few roads available to evaluate damage indicators or determine beginning and end points. Thankfully, Landsat 8 imagery was available in the online Damage Survey Interface* (DAT beta version) that depicted the swaths of blown down forests along the tornado paths that tracked through areas where the storm survey teams could not access. Landsat imagery allowed NWS Nashville personnel to extend two of the tornado paths by several more miles than originally estimated.
*Since April 27, 2011, NASA’s Short-term Prediction Research and Transition, or SPoRT Center, has provided satellite imagery to the NWS to assist with their damage surveys. Starting 2012, SPoRT began incorporating imagery into the NWS’s Damage Assessment Toolkit, or DAT. The DAT is a smartphone, web browser, and tablet application that allows NWS meteorologists to go out in the field and perform a detailed storm damage survey. SPoRT incorporates various satellite imagery, including Landsat 7 and 8, into the DAT as an extra layer of information that NWS meteorologists can use to compare to their storm survey track. {details provided by NASA Research Meteorologist Andrew Molthan}

On Key

Recent Posts

STELLA Photos

STELLA Spring Webinar: April 15, 2024

STELLA users will talk about their experiences using the DIY spectrometer during this webinar. Panelists include Bianca Cilento (RIT), Karen Karker (SUNY), and Peder Nelson (OSU and NASA GLOBE Observer).

Read More »
On Key

Related Posts

STELLA Photos

STELLA Spring Webinar: April 15, 2024

STELLA users will talk about their experiences using the DIY spectrometer during this webinar. Panelists include Bianca Cilento (RIT), Karen Karker (SUNY), and Peder Nelson (OSU and NASA GLOBE Observer).

Read More »