Yellowstone National Park sits on top of a vast, ancient, and still active volcano. Heat pours off its underground magma chamber, and is the fuel for Yellowstone’s famous features—more than 10,000 hot springs, mud pots, terraces and geysers, including Old Faithful.
But expected development by energy companies right outside Yellowstone’s borders have some fearing that Old Faithful could be cheated out of its energy.
“If that geothermal development outside of the park begins, we need to know whether that’s going to cause Old Faithful to suddenly stop spewing,” says Rick Lawrence of Montana State University.
Geothermal energy development is here to stay, says Yellowstone Park geologist Cheryl Jaworowski, but it has also raised some big questions for the National Park Service, which is tasked by Congress to monitor and protect Yellowstone’s unique landscape.
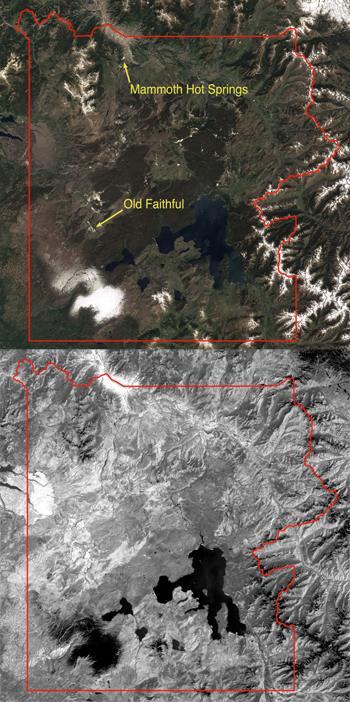
The park funded a study by Lawrence and his coauthor Shannon Savage to apply a new perspective to the problem of tracking geothermal activity. Their work is being presented at the American Geophysical Union conference in San Francisco on Friday, December 9. Lawrence and Savage used both visible light and heat-sensitive Landsat data channels to get a broad view of the park’s geothermal activity.
Their project is part of a new monitoring plan the park implemented in 2005. The plan uses remote sensing and airborne reconnaissance to observe geothermal changes across all of Yellowstone in a systematic and scientific manner. In the past, scientific studies on the ground tended to focus on individual features, and the only park wide estimate of Yellowstone’s heat was derived from a chemical product of geothermal systems that appears in the river system. But with different technology available today, says Jaworowski, the park wants to expand its monitoring options.
To understand Yellowstone’s geothermal system, “we need to start looking at the forest rather than the individual trees,” says Jawrorski. And one way to see Yellowstone’s geothermal “forest” is to get a view from space.
Circling Earth from a height of 438 miles, the Landsat satellites have been gathering for decades a huge amount of data about the land surface. A single scene can take in the entirety of Yellowstone National Park, and the data it gathers is much more than a pretty picture. In addition to measuring the visible light in the electromagnetic spectrum—what we can see—the Landsat satellites each have an instrument that detects waves in the thermal band—heat energy.
Earth radiates heat all the time because it is warmed by the sun. Like a sponge, the ground absorbs solar energy, and like when you squeeze off excess water, the Earth reemits some of that solar energy at a longer wavelength back into space. But in Yellowstone, the total energy picked up by the satellite includes energy produced by the Earth itself, geothermal energy.
“It’s very hard to tease out the geothermal energy,” says Lawrence. The amount of solar energy reemitted depends on air temperature, vegetation cover, and soil moisture among other variables, and geothermal energy is only a small fraction of the total. To estimate changes in the geothermal system, Lawrence and Savage looked back in time and selected one image per year from 1986 to 2007 (with a few gaps due to cloudy days). Because solar effects vary from year to year and with weather conditions, they subtracted out the average heat emitted from the surface of Yellowstone for each year.
The observed changes from year to year would then be primarily attributable to geothermal changes. The scientists then compared these images with known geothermal events during that time period.
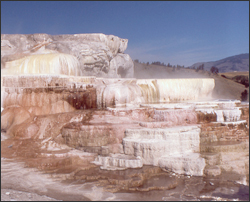
Minerva Terraces in the Mammoth Basin was one of those geothermal events. In 1998, mineral-rich, near-boiling water bubbled over the Minerva’s broad steps, depositing calcite on the face of each terrace. Heat-loving organisms colored the white surface a dozen shades of pink, yellow, and green. A year later, the Terraces were a ghost town. “There was no steam, no color, and then it started crumbling away because it was very soft calcite,” says Savage. Minerva’s colorful ecosystem collapsed when the hot water stopped flowing.
That collapse was reflected in the satellite data Lawrence says. In the Landsat scenes from 1998 and 1999, “the amount of energy coming off the Minerva Terrace area went down.”
But not all the changes were expected. A lone hiker on a boardwalk at Jewel Geyser snapped a picture of rocks flying everywhere in a geothermal explosion. But in the Landsat data where the scientists would have expected more heat, “the temperature actually went down, then it went back up afterward,” says Lawrence. At the time no ground temperature measurements were made so the science team doesn’t know why.
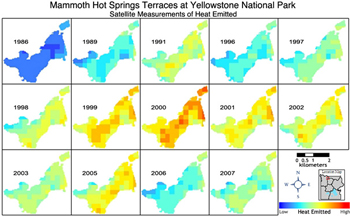
What this means for real-time monitoring at this stage of the project, says Lawrence, is that the satellite data can tell Park managers when big changes occur in a geothermal area, but not necessarily what is happening, or exactly where. Landsat thermal pixels used in this study are 120 meters on a side, much bigger than many of Yellowstone’s geothermal landmarks, many of which can be as small or smaller than a one meter.
This relatively large pixel size is one of the limiting factors on Landsat’s usefulness, says Savage. Many small events, like a hiking trail to Beaver Ponds that disappeared by Narrow Gauge Spring in the summer of 1998, are too small to appear in the Landsat data.
Despite these uncertainties, Landsat data’s long-term record, going back to 1984, gives scientists clues as to how geothermal events could be interconnected underground. If two areas tend to change in similar patterns, that suggests they might share the same plumbing. While geothermal sites outside the park were outside Lawrence and Savage’s study area, by using this type of analysis, scientists may be able to see if there are —or are not —any connections to areas inside the park. For example, two areas that were long thought to be connected, the Norris Geyser Basin and Mammoth Hot Springs, did not show any similar trends and so may not be connected underground in any way.
Using satellites to monitor changes in Yellowstone’s geothermal activity is still in its early stages, says Park geologist Cheryl Jaworowski. “We have some initial numbers but a lot more work needs to be done,” she says, particularly in further resolving geothermal from solar energy, which remains one of the biggest challenges. One thing she wants to try is to take Landsat thermal scenes at night to try to reduce the amount of solar energy obscuring the geothermal signal.
If they can resolve that problem and perhaps eventually get higher resolution thermal data in the future, Savage says that Landsat as a monitoring tool has a lot of potential. The next Landsat satellite, the Landsat Data Continuity Mission is scheduled to launch in early 2013, and it has a new thermal instrument that will add to the Yellowstone geothermal record in the coming decade.
Source: Ellen Gray, NASA’s Earth Science News Team
Further Information:
+ Landsat satellites Track Yellowstone’s Underground Heat, NASA Earth


