
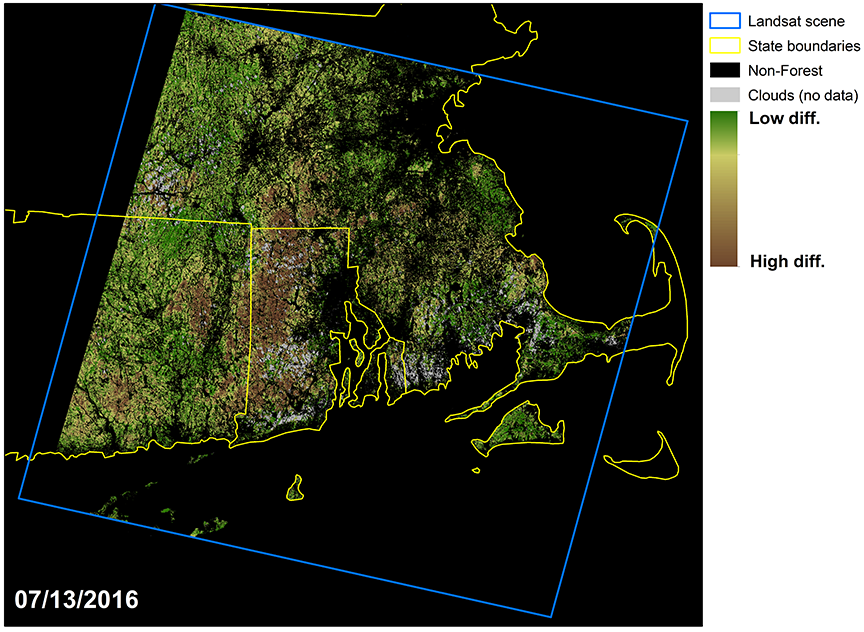
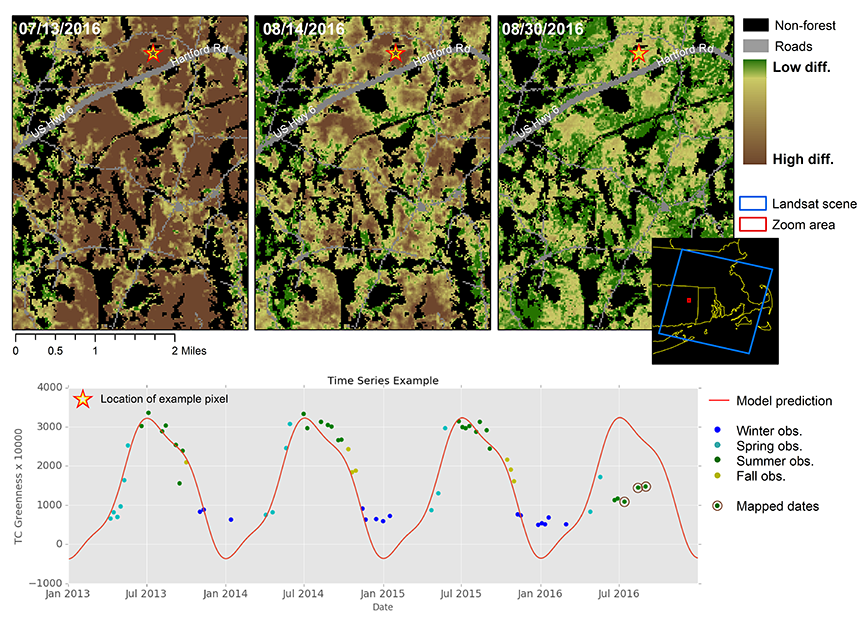
Using time series of Landsat images, she generates predicted images based on a model fit to historical Landsat observations. These predicted images are then compared with actual images acquired on a given date, creating a series of difference maps that capture and quantify the damage.
“It’s a straightforward process of subtraction,” she explains. “It’s characterizing atypical patterns in forest vegetation condition over large areas, plus tracking through time, which yields near-real-time monitoring of disturbance.” Pasquarella has mapped eastern Massachusetts, Rhode Island and some of eastern Connecticut, comparing model predictions of vegetation “greenness” to actual observations for several dates in July and August.
Where traditional monitoring of gypsy moth damage to vegetation has been done with aerial surveys that take hundreds of hours by pilots in small planes criss-crossing the state once per season and technicians later hand-mapping areas of disturbance, a new Landsat image is acquired every 16 days and automated algorithms for extracting change information are now available.
Pasquarella says a couple of factors have made working with Landsat images easier and more fruitful recently, paving the way for such analyses at the intersection of imagery and ecology. First, Landsat images that had once been prohibitively expensive became available for free public access in 2008. But with few analytical tools designed to work on time series of Landsat images, it was still difficult to make use of the complete Landsat record for a given area.
However, she adds, “Now the algorithms are maturing and a lot of new techniques are opening up. It’s finally becoming practical to access and use these data for operational monitoring of both short- and long-term changes in ecosystem properties.”
The data analyst says that Landsat hasn’t typically been used to monitor temporary, event-based or short-term occurrences, but she calls the capability an “exciting new use for this sort of analysis.” Surveying conditions rapidly and repeatedly “are two ways of getting a snapshot of damage over large areas and a level of detail that an aerial survey can never achieve,” she notes.
Coarser resolution, Moderate resolution Imaging Spectroradiometer (MODIS) imagery has been used by others to compare gypsy moth damage at different points in time, Pasquarella says, “but this approach is fundamentally different than the observed vs. predicted comparisons I am doing with Landsat. The time series approach I’m using allows for rapid large-area estimation of damage at a greater temporal frequency than afforded by aerial surveys and a higher resolution than MODIS.”
Pasquarella recently finished her Ph.D. with Curtis Woodcock at Boston University using Landsat time series to improve mapping of forest communities and monitoring of wetland changes associated with beaver activity.
She says, “This sort of near-real-time monitoring to assess gypsy moth impacts is an exciting new area of Landsat time-series research, and we are very interested in sharing these results with the general public as well as forging new collaborations with other gypsy moth researchers so we can potentially connect field-based monitoring efforts with Landsat observations.”

Be Part of What’s Next: Emerging Applications of Landsat at AGU24
Anyone making innovative use of Landsat data to meet societal needs today and during coming decades is encouraged to submit and abstract for the upcoming “Emerging Science Applications of Landsat” session at AGU24.


