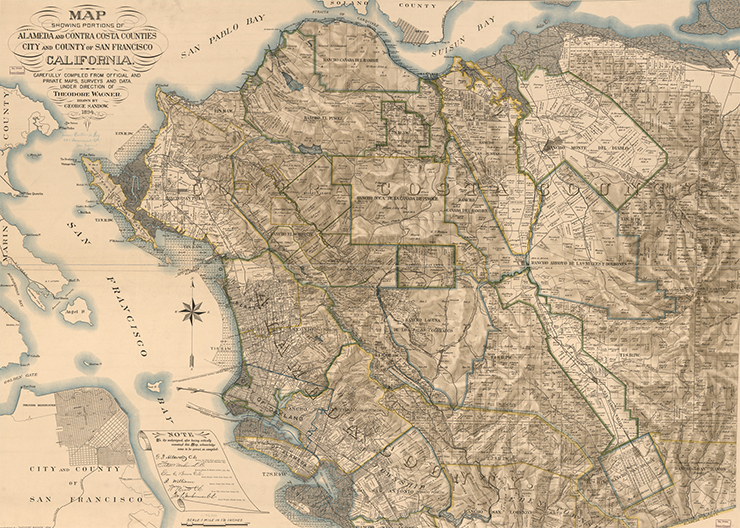
Maps often convey our relationship to the world. In this map of the northern San Francisco Bay and surrounding environs, the early development of the region is recorded in detail. The full and arduous title of this map is “Map showing portions of Alameda and Contra Costa counties, city and county of San Francisco, California, carefully compiled from official and private maps, surveys and data.”
This map can be described as a cadastral map—a map showing ownership of the land. As you look eastward from Oakland, names and organizations are associated with tracks of land—“Wm. H. Glascock,” “Pfeiffer Tract,” “Alameda Water Company,” “Kate King,” “Crocker Est. Co.,” etc.
Across the Bay, the city of San Francisco is merely a fraction of its modern-day size. Market Street clearly defines the north-south street grid of what today is Downtown and the Financial District with the southwest-northeast grid pattern of the South of Market section of the city. (Market Street is also easily spotted in this 1868 Bird’s Eye view of San Francisco.)
By 1894, when this map was made, San Francisco had already transformed from a Spanish Mission and Mexican Ranchero “little community” visited mainly by trappers to a bustling gold boomtown receiving a thousand immigrants per week in 1849 and then into an established metropolis (sometimes referred to as the Paris of the West) striving for municipal infrastructure improvements and often stymied by machine politics.
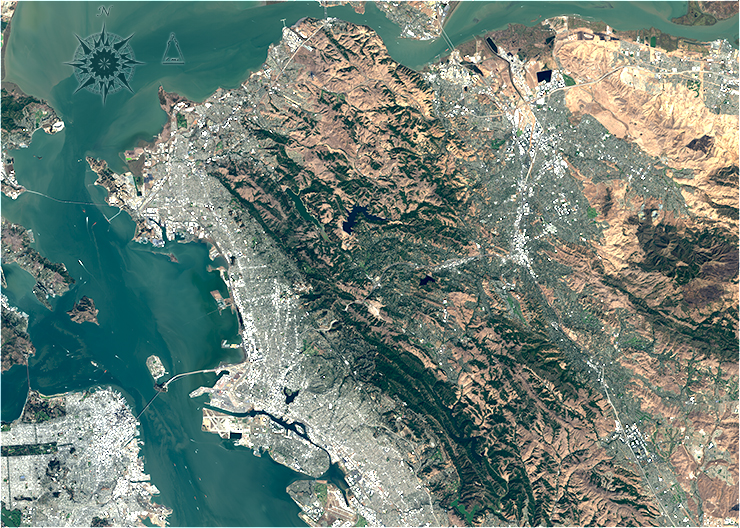
What is striking when comparing the street grid of 1894 San Francisco to the natural color Landsat 8 image acquired on August 23, 2013 is the small portion of the peninsula that the city covered then compared to its extent today. The city was also much harder to reach. In 1894, the city could only be visited by sea or by a long land journey around the southernmost portion of the Bay. Today, the Golden Gate Bridge and Bay Bridge (not to mention the Bay Area Rapid Transit’s transbay tubes) easily convey people and goods into the city of San Francisco.
On the Landsat image, white and grey areas are dense development. During the intervening century between the map’s creation and the Landsat image, the named land parcels were subdivided and developed as the region’s population marched steadily westward across the San Francisco peninsula and eastward into the foothills of Alameda County, becoming more connected with each passing year.
+ download large 1894 map
+ download large Landsat 8 image
References:
Library of Congress, “Map showing portions of Alameda and Contra Costa counties, city and county of San Francisco, California, carefully compiled from official and private maps, surveys and data” Visited 19 Dec. 2013
The Virtual Museum of the City of San Francisco “From the 1820s to the Gold Rush” Visited 19 Dec. 2013.
SFist, “San Francisco, ‘the Paris of the West’” Visited 19 Dec. 2013.
Wikipedia, “History of San Francisco.” Visited 19 Dec. 2013
Images created using Landsat 8 OLI bands 4,3,2 The images were collected August 13, 2013. Images by Mike Taylor using Landsat data available from the USGS archive. Caption by Laura Rocchio.