Preliminary Spectral Response of the Operational Land Imager

Preliminary Spectral Response of the Operational Land Imager

band-average relative spectral response curves
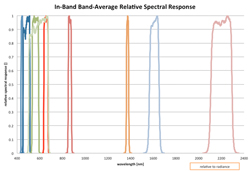
Image 1. The band-average relative spectral response curves for the LDCM Operational Land Imager (OLI)
The Landsat Data Continuity Missions’s (LDCM’s) fully assembled Operational Land Imager (OLI) instrument was tested under thermal vacuum conditions by the instrument vendor, Ball Aerospace & Technologies Corp. During testing the band-average relative spectral radiance responses of the OLI were measured. The relative spectral response curves are shown in Image 1.

To perform the spectral response measurements, a tungsten halogen lamp was used to illuminate a double monochromator. (A monochromator is an optical device that allows a small range of wavelengths to be separated from an input light source.) The light output from the monochromator was then directed through a beamsplitter which sent part of the light to a monitor detector and part through a collimator (a device which creates a parallel beam or “column” of light) and subsequently through a window and into the thermal vacuum chamber where OLI was (Image 2).

Schematic of the testing set-up used to measure the OLI relative spectral response.
Image 2. Schematic of the testing set-up used to measure the OLI relative spectral response. Credit: Julia Barsi

The OLI was pointed using ground support equipment so that the collimated beam covered 16 different locations for each band, one position at the center of each Focal Plane Module (FPM) and one each at the ends of the two extreme cross-field FPM’s. The size of the beam was such that there was sufficient signal to characterize about 60 detectors at each location. At each location OLI data were collected, with the monochromator stepping through the OLI spectral bandpass (See Table 1). The characterization was performed across a fixed wavelength range for each band that was designed to achieve responses down to at least the 0.005 relative spectral response point.
Full article:
Preliminary Spectral Response of the Operational Land Imager In-Band, Band-Average Relative Spectral Response

Get the latest from Landsat in your inbox.


By submitting this form, you are consenting to receive marketing emails from: Landsat Science. You can revoke your consent to receive emails at any time by using the SafeUnsubscribe® link, found at the bottom of every email. Emails are serviced by Constant Contact
On Key

Recent Posts

Map shows South Korea with waterways highlighted. In the top right corner is a north arrow and in the bottom left corner is a legend of different rivers in South Korea.

Monitoring Water Quality in South Korea

South Korea is facing a water quality problem. Researchers Hyunglok Kim and Seongjun Lee from the Gwangju Institute of Science and Technology (GIST) embarked on developing a model to predict water quality indicators in near real-time.

Read More »
Landsat outreach specialist Allison Nussbaum and GEDI/UMD Faculty Specialist Talia Schwelling hold Landsat/GEDI postcards at the NASA exhibit booth at AGU24.

Landsat at AGU24

The NASA Landsat Science and Outreach teams attended the American Geophysical Union’s annual meeting in DC in December. At AGU24, they shared research and educated the public about Landsat.

Read More »
On Key

Related Posts

Map shows South Korea with waterways highlighted. In the top right corner is a north arrow and in the bottom left corner is a legend of different rivers in South Korea.

Monitoring Water Quality in South Korea

South Korea is facing a water quality problem. Researchers Hyunglok Kim and Seongjun Lee from the Gwangju Institute of Science and Technology (GIST) embarked on developing a model to predict water quality indicators in near real-time.

Read More »