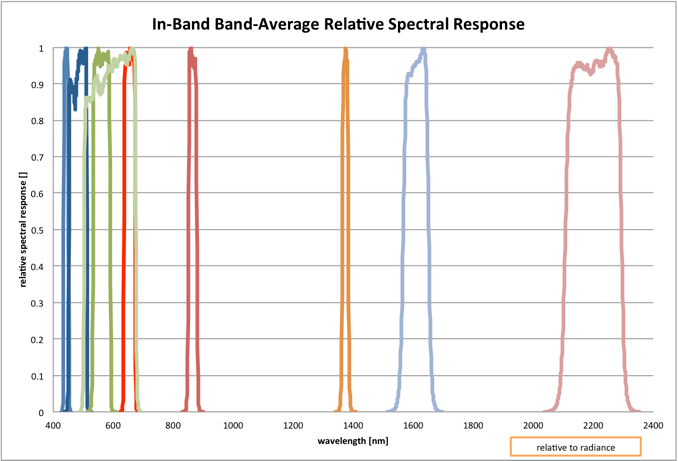
The band-average relative spectral radiance responses of the Operational Land Imager (OLI) are provided in this spreadsheet . A summary of the band responses is provided in Table 1. These responses are from measurements made of the fully assembled instrument under thermal vacuum conditions conducted by the instrument vendor, Ball Aerospace & Technologies Corporation (BATC).

+ Larger Image
| Band | Bandwidth [nm] | FWHM wavelength [nm] | Center Wavelength [nm] | |
| lower | upper | |||
| CA | 15.98 | 434.97 | 450.95 | 442.96 |
| Blue | 60.04 | 452.02 | 512.06 | 482.04 |
| Green | 57.33 | 532.74 | 590.07 | 561.41 |
| Red | 37.47 | 635.85 | 673.32 | 654.59 |
| NIR | 28.25 | 850.54 | 878.79 | 864.67 |
| SWIR1 | 84.72 | 1566.50 | 1651.22 | 1608.86 |
| SWIR2 | 186.66 | 2107.40 | 2294.06 | 2200.73 |
| Pan | 172.40 | 503.30 | 675.70 | 589.50 |
| Cirrus | 20.39 | 1363.24 | 1383.63 | 1373.43 |
Table 1. Band-average relative spectral radiance responses of the Operational Land Imager.
For the instrument level measurements, the monochromator input slit was illuminated by a tungsten halogen lamp and the light was passed through a double monochromator. At the output slit of the monochromator a beamsplitter sent part of the light to a monitor detector and part through a collimator and a window in the thermal vacuum chamber to the OLI (Figure 1). The OLI was pointed using ground support equipment so that the collimated beam covered 16 different locations for each band, one position at the center of each Focal Plane Module (FPM) and one each at the ends of the two extreme cross-field FPM’s. The size of the beam was such that there was sufficient signal to characterize about 60 detectors at each location. At each location OLI data were collected, with the monochromator stepping through the OLI spectral bandpass (Table 2). The characterization was performed across a fixed wavelength range for each band that was designed to achieve responses down to at least the 0.005 relative spectral response point. Each OLI detector’s digital response was offset corrected, normalized for temporally and spectrally dependent variations in the illuminating radiance and adjusted for the transmission of the path optics:
| OLI Spectral Band | Monochromator Sampling Bandpass [nm] | Monochromator Step Size [nm] | Monochromator Bandpass [nm] |
| CA | 427-459 | 1 | 1 |
| Blue | 436-528 | 1 | 1 |
| Green | 513-611 | 1 | 1 |
| Red | 626-692 | 1 | 1 |
| NIR | 830-901 | 1 | 1 |
| SWIR1 | 1516-1699 | 2 | 2 |
| SWIR2 | 2038-2356 | 2 | 2 |
| Pan | 488-693 | 1 | 2 |
| Cirrus | 1341-1410 | 2 | 1 |
Table 2. Sampling specifications during pre-launch spectral testing of OLI.
where all quantities are per-wavelength andS is the derived spectral response, Q is the digital response of an OLI detector to the monochromator signal, Q0 is the digital response of an OLI detector to no input radiance, Rm is the correction factor for the radiance output of the monochromator based on the monitor output and the monitor’s radiometric calibration and τOLIpath is the transmission of the optical path between the beam splitter and the OLI. The spectral response is then normalized to unity at the peak response. The spectral response analysis was performed by both BATC and NASA/GSFC independently on these data. The results presented here are from the GSFC analysis.

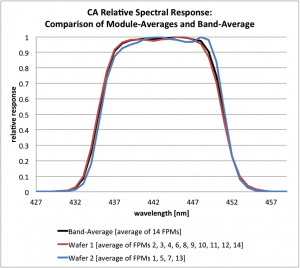
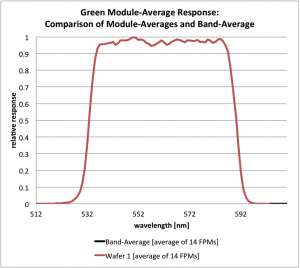
Figure 2. The Band-Average relative spectral responses presented here are averages of the responses from the 14 focal plane modules (FPMs). There is some filter-to-filter variability between the modules, more so in bands where filters from different production lots were used on different modules. For the Coastal/Aerosol band (Band 1), ten of the modules have filters from the first wafer and four modules have filters from the second wafer. The band-average response reflects the differences between the wafers. In the case of the Green band (Band 3), all the filters came from the same wafer, so there is no difference between the wafer-average response and the band-average response.
The test only directly measured about 14% of the OLI detectors in each band, but prior spectral measurements on the filters and detector arrays confirmed that there are no large spectral changes on a per-detector level, so it was sufficient to measure a sample of the detectors at the instrument level.
The spectral responses presented here are the average responses of the 14% of the detectors that were measured in each band. This means that the response does not actually reflect the response of any single detector. The most significant spectral differences across the focal plane are the result of filter-to-filter variations. The green and red bands are the most uniform as all filters were from the same wafer. The other bands used filters from two or more different production batches and were less uniform (Figure 2). Much of the in-band low-amplitude high frequency structure is believed to be due to inadequate correction for the differences in the light path between the OLI and the monitor detector. For most applications this high frequency structure is not significant.
Additional tests were performed to detect response outside of the specified wavelength bandpass of every detector in each band. Those tests showed that only four out of the nearly 70000 detectors on the OLI had any out-of-band response above 10-3 within the required spectral range, and the integrated response beyond the 1% response points was 1% or less of the in-band response. While some spectral cross-talk was apparent in all the SWIR bands, none of it was significant to the band’s in-band response. Details of the out-of-band response will be released separately.
The spreadsheet contains the per-wavelength, band-averaged, in-band relative spectral response, sampled at 1nm intervals along with the standard deviation of the measurements at each wavelength.
References:
Julia A. Barsi, Brian L. Markham and Jeffrey A. Pedelty, “The operational land imager: spectral response and spectral uniformity”, Proc. SPIE 8153, 81530G (2011); doi:10.1117/12.895438
Julia A. Barsi, Kenton Lee, Geir Kvaran, Brian L. Markham and Jeffrey A. Pedelty, “The Spectral Response of the Landsat-8 Operational Land Imager,” Remote Sens. 2014, 6, 10232-10251; doi:10.3390/rs61010232


