During a virtual meeting on January 6 with barge operators who requested NOAA’s charting assistance, Andrew Kampia, the cartographer in charge of the project explained, “You may hear me refer to them as an experiment because we have not created or released a navigational product like this before.”
“The Yukon was literally uncharted,” Kampia told the group. “After some analysis and brainstorming, we decided to create a prototype ENC using only satellite data. This is unprecedented.”
Coast Survey is not able to provide contemporary surveys to acquire data for charting the length of the river, as funding, survey vessel availability, remoteness, and small windows of opportunity to survey are major obstacles. Satellite-derived bathymetry from two navigation seasons between July 2014 and October 2015 helps to fill the void of contemporary data for Western Alaska.
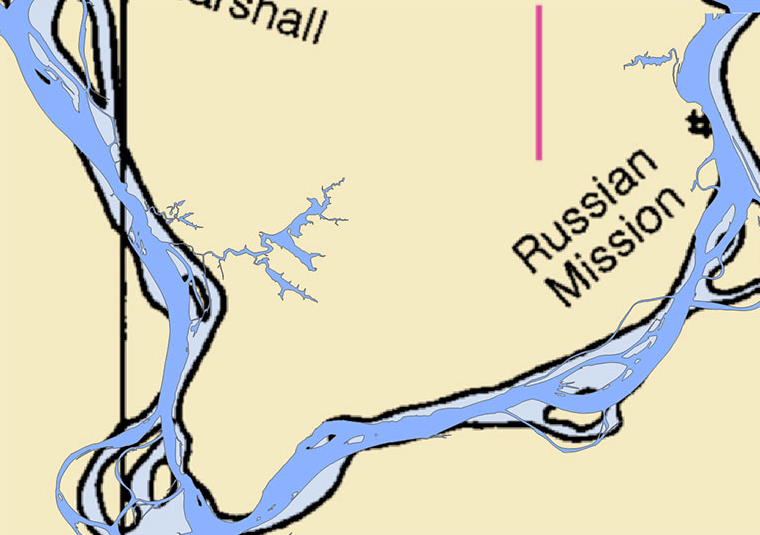
The charts will help to address the concerns of the local barge industry that supplies goods and services to western Alaska and who have had to deal with a lack of data inshore of the 12-foot contour. (The average draft of vessels transiting up river for village deliveries is four to six feet.) The new Yukon River provisional ENCs US4AK98M, US4AK99M, and US4AK00M offer 1:90,000 scale coverage that spans the entrance to the Yukon River, including Apoon Pass to Kotlik, and continues east to Russian Mission.
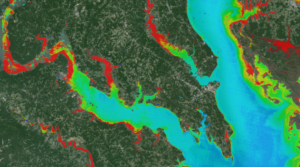
Satellite-derived bathymetry uses satellite images and histograms and performs some logarithmic calculations that can sometimes estimate depths in relatively shallow areas. Or, as in the case of the Yukon, satellite-derived bathymetry can estimate shoals, which are displayed on the Yukon ENCs as obstruction areas. Unlike traditional hydrography, however, satellite-derived bathymetry doesn’t provide exact depth measurements or tidal data at the time the satellite imagery was taken.
“Shoreline depictions are derived from automated processing of satellite imagery,” Kampia said. “We felt pretty confident in the position of the shoreline, but it is below our customary standards, so we added notes to the ENCs.”
Coast Survey has provided two special notes for the Yukon River ENCs:
Warning Provisional ENC
This ENC was constructed using the best data available. All or much of the shoreline, depths and shoals within this ENC are below customary quality, are not corrected for tides, nor based on a known sounding datum. All or much of the charted detail is highly changeable. Navigators should use this ENC with extreme caution.
Satellite Derived Depths
Shoreline, depths, and obstruction areas within the area of this ENC are derived from satellite imagery from 2015. Their vertical accuracy is typically ± 2m. Uncharted dangers may exist.
Since the river is in a constant state of change, Coast Survey will use satellite images after the spring thaws to make annual updates. Late this spring, a satellite-derived bathymetry analyst will examine the first satellite images after the Yukon thaws and is navigable. The Landsat 8 images are available every 16 days as the satellite makes it trip around the globe, so the first usable images may not be available until May or June. After turning the images into shoreline and bathymetric updates, updated ENCs will be issued in early July – or earlier if possible.
“We would like to routinize and improve this process over the coming years based on our analyses,” Kampia said. “We hope to build on these successes and use these solutions in areas other than the Yukon, where traditional surveys aren’t able to provide the charts that navigators need.”
The Office of Coast Survey recently issued the revised U.S. Arctic Nautical Charting Plan, but agency officials stress that it is a “living document,” needing adjustments as priorities change. Hydrographic and cartographic experts will travel to Alaska in March to ask the state’s maritime industry for input that will help future surveying and charting activities for the State.
Related Reading:
+ Avoiding Rock Bottom: How Landsat Aids Nautical Charting

Be Part of What’s Next: Emerging Applications of Landsat at AGU24
Anyone making innovative use of Landsat data to meet societal needs today and during coming decades is encouraged to submit and abstract for the upcoming “Emerging Science Applications of Landsat” session at AGU24.


