In-Band, Band-Average Relative Spectral Response
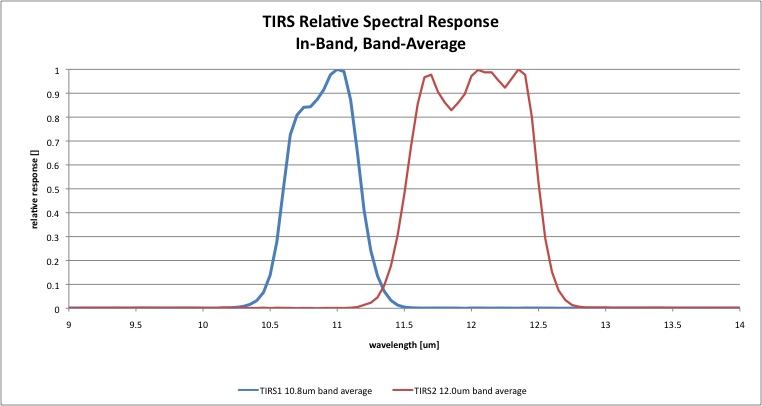
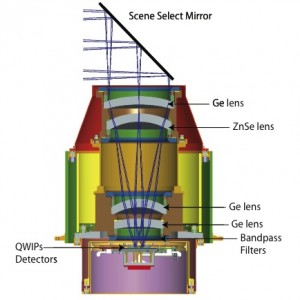
The band-average relative spectral radiance responses of the Thermal Infrared Sensor (TIRS) are provided here . These responses are based on measurements of the individual optical and electro-optical components of the instrument (Figure 1) combined to estimate the end-to-end instrument response.
Filters:
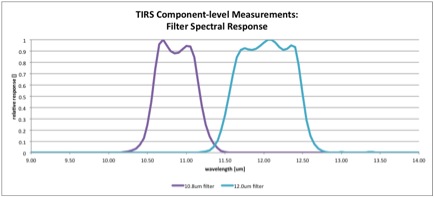
The filter spectral transmissions used in this analysis (Figure 2) were measured at Goddard Space Flight Center (GSFC). A witness sample for each band was measured under vacuum from 1.66 to 20.0 μm at 45K, 60K and 300K. Measurements were made at 1 position at <50nm steps in the in-band wavelength ranges and <100nm steps in the out-of-band wavelength ranges. The spectral bandwidth for the measurements was roughly equal to the sampling steps. The out-of-band region was defined as the range of wavelengths where the response is less than 1% of peak.
Detectors:
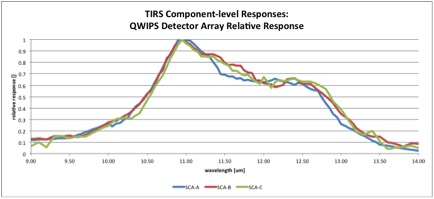
The spectral response of every detector on the TIRS focal plane was measured in the GSFC Detector Characterization Laboratory. There are 640 TIRS detectors across each of the three Sensor Chip Assemblies (SCAs) to cover the full TIRS field of view (see here for more on the design). The spectral response of all the detectors were tested at two different steps during integration due to difficulty in acquiring both in-band and out-of-band response in the same configuration. The SCAs were put in a Dewar and cooled to 43K. A 995C blackbody source illuminated the detectors through a Spectral Pro 300i monochromator outfitted with appropriate order-sorting filters. A calibrated Mercury-Cadmium-Telluride detector was used to determine the monochromator output. The response was sampled at 100 nm or less steps with a bandwidth of better than 80nm, except for wavelengths greater than 13mm where the bandwidths were 175nm.
The in-band response (10-13μm) was measured at the SCA level, before the focal plane was assembled. The out-of-band response (<10μm and >13μm) was measured at the Focal Plane Assembly level, where the three SCAs were mounted together, though each SCA was illuminated separately. Each SCA was exposed to a cold shutter, to the blackbody signal passed through the monochromator, and then again to the cold shutter. The non-illuminated SCAs were used to assess and correct for any drift in background signal.
The in-band and out-of-band responses were by scaling the overlapping measurements in the 6-9μm and 13-15μm ranges to match. The band-average responses are shown in Figure 3.
Optical Elements:

The transmission of witness samples of the two types of lenses, Germanium (Ge) and Zinc Selenide (ZnSe), was measured at GSFC. A 15μm thick spare sample of each of the lenses was tested at 185K: from 3.6 to 25μm for the Ge lens and between 2 and 25μm for the ZnSe lens.
The combined telescope transmission is taken as the per-wavelength product of the transmissions of three Ge lenses and one ZnSe lens.
The component and combined telescope responses are shown in Figure 4.
Scene Select Mirror:
The Scene Select Mirror (SSM) is coated gold, which has an extremely flat reflectance beyond 0.8μm. Therefore, the reflectance of the SSM is treated as a constant throughout the TIRS bandpasses and is not included in the overall component-level RSR calculation.
Instrument Spectral Response:
The final instrument response is the product of the QWIP detectors, the filter, and the telescope.
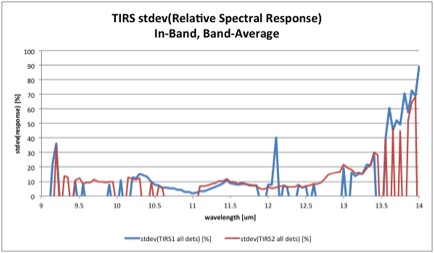
The detector responses are available for every detector, but the filter and telescope responses are treated as stable across the focal plane. The band-average instrument response is shown at the top and provided in the spreadsheet . The spreadsheet contains the per-wavelength, band-averaged, in-band relative spectral response, sampled at 0.05μm intervals along with the standard deviation over all detectors for each wavelength of the measurements (Figure 5).
