

Managers seek sustainability because forests work for us in many ways—storing carbon (and providing us with oxygen as a byproduct), protecting biodiversity, and providing wildlife habitat, recreation, water, and timber resources. The tree census enables forest managers to understand how climate change, population expansion, and timber harvesting are impacting forests and the ecosystem services they provide.
The Forest Inventory and Analysis program, or FIA, is the arm of the Forest Service that is responsible for reporting on forest status each year. To do this, FIA has developed a sampling protocol whereby field plot measurements are made and then extrapolated to show regional forest trends.
Four regional research stations measure a permanent network of field plots using a two-phased sample design. In the first phase, aerial photos are used to classify plots into forest and non-forest classes; and in the second phase, field crews visit all the forested plots to record detailed measurements including tree size and species. Analysts then use the field measurements to derive estimates of forest area and volume at the state and county levels. Traditionally, remote sensing data (often derived from Landsat) have been used by FIA to develop strata for post-stratification, a statistical technique where spatial data is used to improve the precision of sample-based estimates, and to map forest location and extent.
In the expansive Western U.S., it takes FIA a decade to measure all of their field plots, so they use a rotating panel system that ensures 10 percent of all plots are measured every year. Though ideally, they would like all of the plots to be measured annually.
A recent study published in Remote Sensing of Environment, has shown that Landsat Time Series (LTS) can improve FIA’s inventory system by (1) allowing analysts to detect disturbance events on all plots every year and by (2) providing historical change maps which can be used to improve the spatial land cover strata that feed into FIA’s statistical calculations.
Lead author Todd Schroeder, from the U.S. Department of Agriculture’s Forest Service Rocky Mountain Research Station in Ogden, Utah, and collaborators tested these new LTS methods in a 1.6 million hectare study area located in Utah’s Uinta Mountains. Forest covers more than half of this area with a mix of Pinyon-Juniper, Aspen, Birch, Fir, Spruce, Hemlock, Lodgepole Pine, and Douglas-fir. (Unsurprisingly, Uinta is the Native American word for “pine forest”).
FIA has 449 forested plots in this study area which, starting in 2004, has been plagued by mountain pine beetles and spruce beetles leading to high rates of tree mortality. Each year FIA collects detailed field data (including ownership, location, species variety, tree size, volume, growth, health, mortality, and removal) for ~45 of these plots to estimate tree cover and disturbance; this study has shown that these estimates improve when Landsat time series are used to observe disturbance annually on the other ~400 unmeasured field plots.
The study authors found that Landsat data could be used to discern stress caused by insects, drought and disease; fire; harvest; mechanical brush clearing such as “chaining” (a clearing method using two tractors and massive navy anchor chains) as well as an “other” class, that captures non-categorized disturbance for all plots. In cases of abrupt disturbances, Landsat data was able to provide the year of onset. By providing supplemental disturbance history, LTS can help FIA get a better grasp on current forest conditions including disturbance trends.
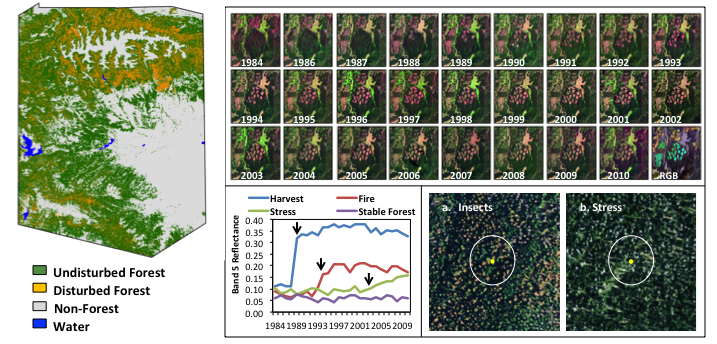
Stacks of growing season Landsat images from 1984 to 2010 were analyzed by human interpreters to view and record each plot’s disturbance history, as well as to produce a historical disturbance map for the study area. Landsat’s extensive archive reaching back more than four decades and its 16-day repeat cycle made it well suited for this study.
“Now that the entire Landsat archive is freely available it has become economically feasible to monitor disturbance over large areas using satellite time series,” Schroeder writes.
Schroeder found that the hybrid approach of combining FIA plot measurements with LTS observations derived from analyst interpretation and disturbance maps, provided more precise estimates of disturbance—disturbance estimates were 65 percent higher than using plot data alone.
The authors think this technique shows much promise: “It is possible that combining the improved frequency and spatial coverage of LTS observations with the detailed, but less frequent FIA field data might provide the most complete picture of where and how disturbance is impacting the greater landscape.”
Based on the success of this initial study FIA is planning future investigations into the broader use of LTS data within its U.S. wide forest inventory system.
Reference:
Related AGU presentations today:
Applying shape selection methods to Landsat time series for mapping forest disturbance history and cause (B51L-04)
Friday, December 19, 2014, 8:45 AM – 9:00 AM, Moscone West-2004
A Quarter-Century U.S. Forest Disturbance History Mapped from Landsat (B51L-05)
Friday, December 19, 2014, 9:00 AM – 9:15 AM, Moscone West-2004
Using NASA Earth Exchange (NEX) to develop annual US Forest Disturbance products (B53B-0189)
Friday, December 19, 2014, 1:40 PM – 6:00 PM, Moscone West-Poster Hall
Using Landsat to Diagnose Trends in Disturbance Magnitude Across the National Forest System (B53B-0179)
Friday, December 19, 2014, 1:40 PM – 6:00 PM, Moscone West-Poster Hall
Spatial Estimation of Timber Production and Carbon in Harvested Wood Products Using Remote Sensing (B53B-0180)
Friday, December 19, 2014, 1:40 PM – 6:00 PM, Moscone West-Poster Hall
Science brief written by Laura E.P. Rocchio

Be Part of What’s Next: Emerging Applications of Landsat at AGU24
Anyone making innovative use of Landsat data to meet societal needs today and during coming decades is encouraged to submit and abstract for the upcoming “Emerging Science Applications of Landsat” session at AGU24.


