
Presentation Title
Monitoring Urbanization Processes from Space: Using Landsat Imagery to Detect Built-Up Areas at Scale
What are the major findings of this research?
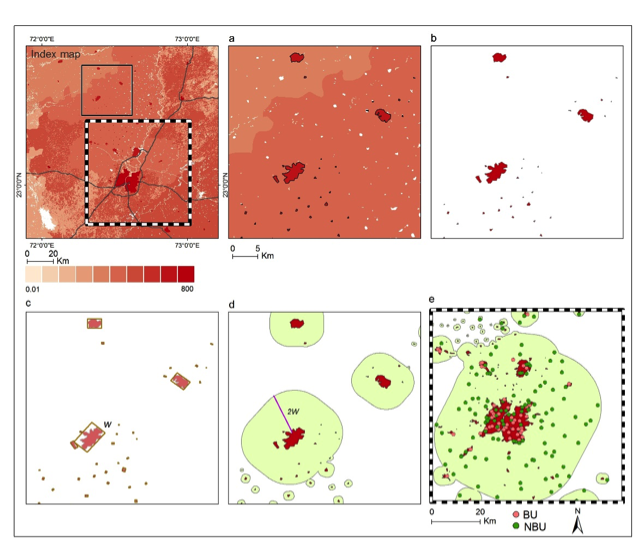
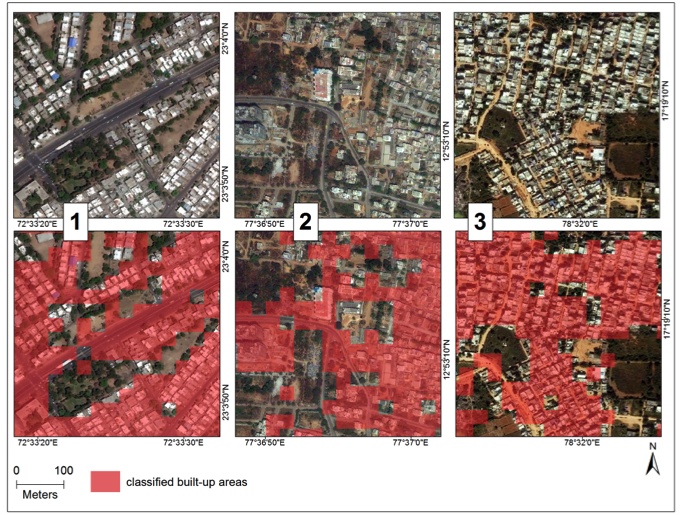
A major factor inhibiting more remote sensing urban research is the lack of comprehensive datasets that give the “ground-truth” regarding urbanization. Such data is essential for any supervised machine learning and for validation of existing maps of urban areas. In this study we provided, for the first time, reliable and comprehensive open-source ground-truth data that marks urban areas in one country, India. The dataset consists of 21,030 polygons that were manually labeled as “built-up” urban areas or as “not built-up” areas. We performed supervised image classification in Google Earth Engine (GEE), using alternative classifiers, with Landsat 7 and 8 as inputs to the classifiers. With this dataset, we produced high-quality maps of built-up areas in India, across space and time, capturing the fabric of built-up urban areas, as well as the fine boundaries between cities and their periphery. With Random Forest as the classifier, we achieved a high overall accuracy rate of around 87 percent in identifying built-up areas. In addition, we found that the performance of the classifiers strongly improves as the size of the training dataset increases, and that the classifiers perform well also when the training examples are sampled from areas with heterogeneous land cover.
Why is it important to monitor urbanization trends?
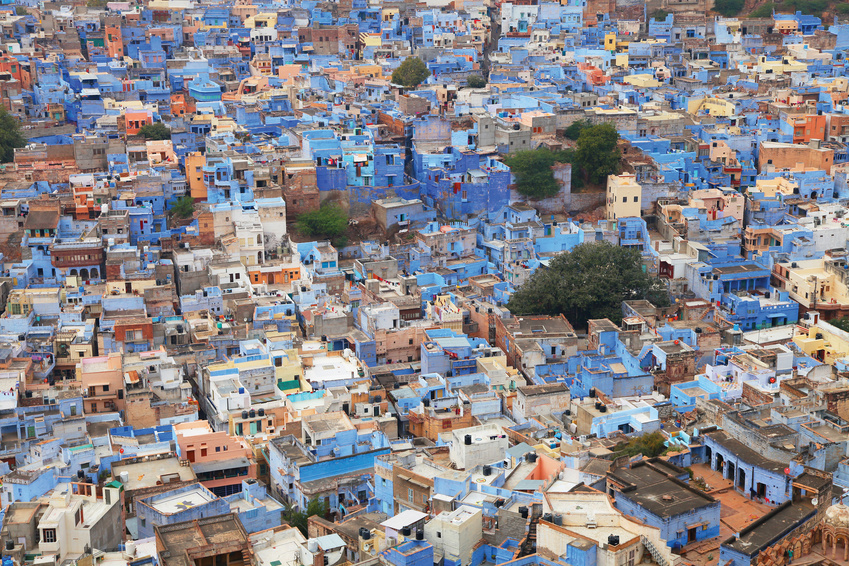
While urbanization in rapidly growing nations is helping lift hundreds of millions of people out of poverty, it is also creating immense societal challenges by expanding greenhouse gas emissions, destabilizing fragile ecosystems, and creating new demands on education, health, and transportation infrastructure. Understanding the ecological, environmental, social and economic impacts of these changes is essential for preserving a sustainable society. Measuring urbanization with a high degree of geographic precision and in as close to real time as possible will transform how we design public policy to achieve successful urban growth and to address many of the most persistent challenges of economic development.
What insight did you gain from Landsat that would have been impossible to glean otherwise?
Landsat has undoubtedly transformed our ability to understand urbanization processes and how cities expand and evolve. It is well known that there is an inherent trade-off between the spatial, spectral and temporal resolutions of Earth-observation data. Yet, the multi-spectrality of Landsat, its relatively high spatial resolution, its revisit period, and especially the long observational record that made millions of scenes publicly available, make Landsat a key asset for the research community. In our research, we found that although the spectral resolution of Landsat 7 is lower than that of Landsat 8, with the addition of per-pixel NDVI and NDBI indices to Landsat 7, the classifier`s performance improve close to that when Landsat 8 is used for the input. In other words, despite the lower spectral resolution of Landsat 7, the addition of spectral indices to the classifiers improves the classification, thus allowing us to study urbanization over long time horizons.
Why does your classification capture fine boundaries between built-up and other land cover types better than other urban datasets?
The key is in both sides of the equation: the input and the output. For the input, we used all Landsat scenes in a given a year, while accounting for TOA calibration, cloud coverage and additional per-pixel indices. This allowed us to create high quality “clean” Landsat composites at scale. For the output, we constructed a comprehensive stratified ground-truth dataset of 21,000 examples that span the entire country. When creating this dataset, we accounted for the heterogeneity in the types of land cover found in India`s diverse geographical regions. This heterogeneous and comprehensive dataset allowed us to build classifiers that are able to detect built up land cover in a geographically diverse country such as India.
Co-authors:
Wei You
University of California San Diego
Gordon Hanson
University of California San Diego
Amit K. Khandelwal
Columbia University of New York
Related reference:
Goldblatt, R.; You, W.; Hanson, G.; Khandelwal, A.K. Detecting the Boundaries of Urban Areas in India: A Dataset for Pixel-Based Image Classification in Google Earth Engine. Remote Sens. 2016, 8, 634.
The study was funded in part by the School of Global Policy and Strategy’s Center on Global Transformation, UC San Diego.
Anyone can freely download Landsat data from the USGS EarthExplorer or LandsatLook.
Further Reading:
+ Landsat Abounds at #AGU16

Be Part of What’s Next: Emerging Applications of Landsat at AGU24
Anyone making innovative use of Landsat data to meet societal needs today and during coming decades is encouraged to submit and abstract for the upcoming “Emerging Science Applications of Landsat” session at AGU24.


