
Presentation Title
Development of new index for forest fire risk using satellite images in Indonesia through the direct spectral measurements of soil
What are the major findings of this research?
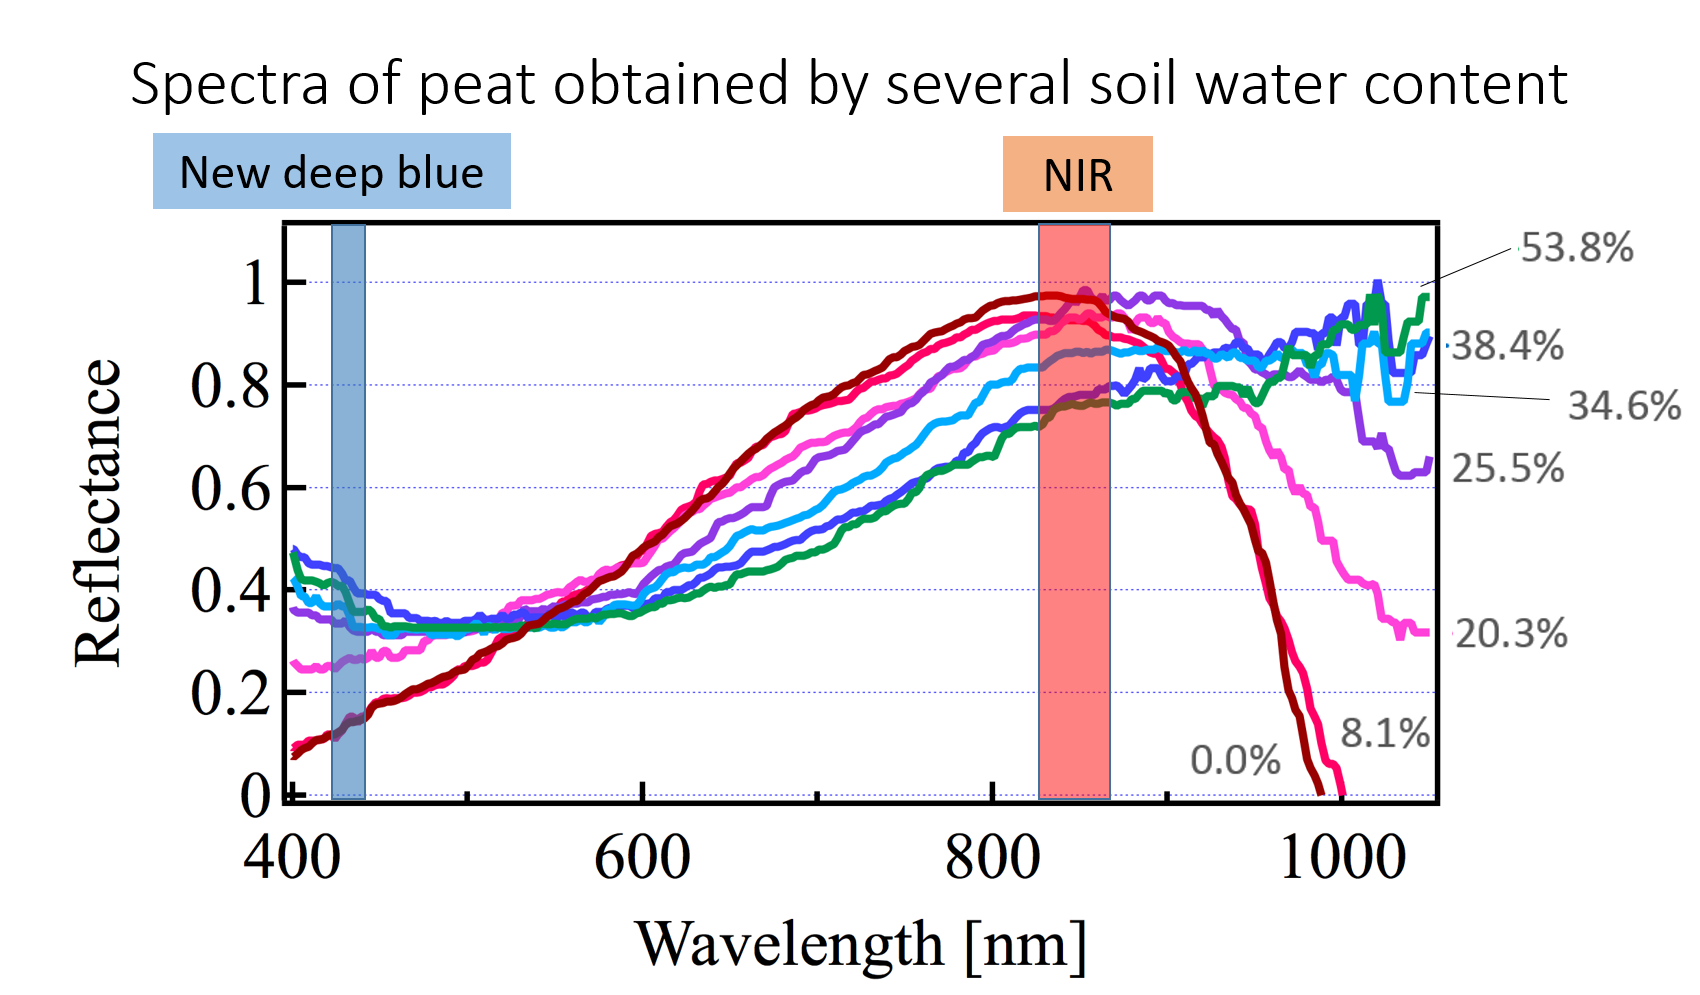
In near infrared (deep blue) region, reflectance directly measured from the peat moss are more complex than previously thought, in case of high water content of soil and of the peat soil rich condition. Those results differ from the findings of a high absorption coefficient of pure water in both wavelength regions.
What are the implications of your findings?
Some indices for the vegetation and the soil in remote sensing, such as Normalized Difference Water Index (NDWI) and Normalized Difference Soil Index (NDSI), have been assumed that the reflectance related with water increases linearly as wavelength becomes longer. Those indices have been used for remote sensing to know surface soil water content, however, our results indicate that the assumption cannot be applied for the area covered with peat such as in Indonesia. We should directly measure the spectra of soil in individual ground location for remote sensing.
What insight did you gain from Landsat that would have been impossible to glean otherwise?
There is a new deep blue band on Landsat 8. It can be essential to know precisely the surface water content of soil.
Why does peat moss water content amount affect reflectance in the new deep blue band?
Reflectance in this wavelength region cannot be determined by that of pure water. It can be affected by the soil itself and the soil components. So, the influence for the reflectance would depend on the respective type of soil.
Co-authors:
Asahi Hashimoto
Hokkaido University
Moka Akita
Hokkaido University
Yuito Takahashi
Hokkaido University
Hikaru Suzuki
Hokkaido University
Yoko Hasegawa
Hokkaido University
Yuka Ogino
Hokkaido University
Nobuyasu Naruse
Hokkaido University
Yukihiro Takahashi
Hokkaido University
This work is supported by Japan Science and Technology Agency (JST), This work was performed on Global Science Campus program in Hokkaido University.
Anyone can freely download Landsat data from the USGS EarthExplorer or LandsatLook.
Further Reading:
+ Landsat Abounds at #AGU16

Be Part of What’s Next: Emerging Applications of Landsat at AGU24
Anyone making innovative use of Landsat data to meet societal needs today and during coming decades is encouraged to submit and abstract for the upcoming “Emerging Science Applications of Landsat” session at AGU24.


