A Spatial Toolbox to Help Deal with Flooding in Vietnam

A Spatial Toolbox to Help Deal with Flooding in Vietnam

mekong river delta
Buildings along the Mekong River Delta in Vietnam. Photo credit: Steve Lovegrove
Dr. Bui Quang Thanh is a Research Geographer at the Hanoi University of Science in Vietnam. Today at #AGU16, Dr. Thanh is giving a talk on a new collaborative platform his team has developed to help Vietnam plan for and respond to flooding. Flooding often plagues Vietnam, negatively affecting residents and economic development nationwide. By combining a web-based GIS with spatial analysis tools for flood hazard risk assessment, this platform is intended to assist with information exchange and disaster management, which will lead to better and faster decision making. Here’s what Dr. Thanh told us about his project:
Presentation Title
Collaborative GIS for flood susceptibility mapping: An example from Mekong river basin of Vietnam
What are the major findings of this research?
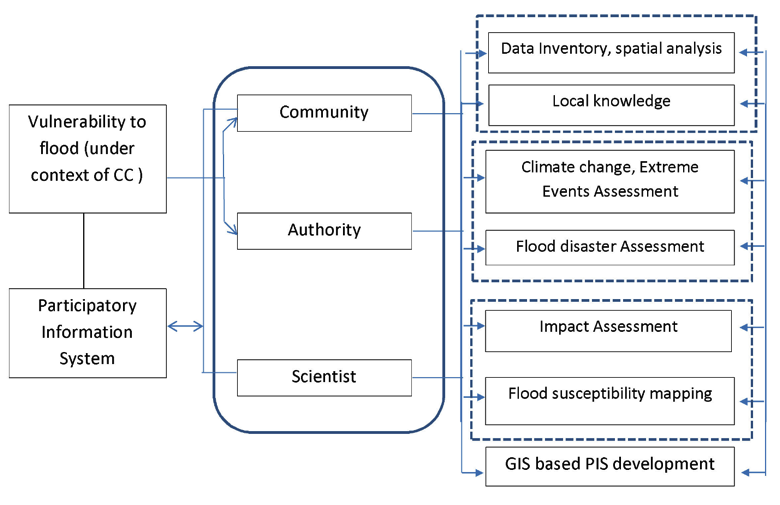
There is a local demand for a Participatory Information System (PIS) that integrates the multiple and inter-disciplinary scientific and technological knowledge with local experiences. Such integration can provide an effective tool for increasing community resilience towards climate change-induced disasters (flood, drought…), and for facilitating local sustainable development practices by means of mass participation.
How will your collaborative platform potentially help during future floods in Vietnam?
This approach is typically directed toward the widest possible array of end users (decision makers, managers, local communities) whose contributions may vary considerably. The combination of these benefits may result in direct, specific intersectional actions, and thus provide for better analysis, control and decision-making.
Why were Landsat data used to calculate index images?
Landsat data are free and easily accessible with valuable spectral information (via the USGS EarthExplorer or Google Earth Engine).
concept model of GIS
A concept model of the collaborative GIS system designed for flood risk magnitude prediction. Image credit: Bui Thanh

 
This research is funded by the Ministry of Science and Technology, Vietnam. The author’s participation at the AGU fall meeting was funded by the Asian Disaster Preparedness Center, SERVIR-Mekong.
 
 
Anyone can freely download Landsat data from the USGS EarthExplorer or LandsatLook.
Further Reading:
+ Landsat Abounds at #AGU16

Get the latest from Landsat in your inbox.


By submitting this form, you are consenting to receive marketing emails from: Landsat Science. You can revoke your consent to receive emails at any time by using the SafeUnsubscribe® link, found at the bottom of every email. Emails are serviced by Constant Contact
On Key

Recent Posts

Map shows South Korea with waterways highlighted. In the top right corner is a north arrow and in the bottom left corner is a legend of different rivers in South Korea.

Monitoring Water Quality in South Korea

South Korea is facing a water quality problem. Researchers Hyunglok Kim and Seongjun Lee from the Gwangju Institute of Science and Technology (GIST) embarked on developing a model to predict water quality indicators in near real-time.

Read More »
Landsat outreach specialist Allison Nussbaum and GEDI/UMD Faculty Specialist Talia Schwelling hold Landsat/GEDI postcards at the NASA exhibit booth at AGU24.

Landsat at AGU24

The NASA Landsat Science and Outreach teams attended the American Geophysical Union’s annual meeting in DC in December. At AGU24, they shared research and educated the public about Landsat.

Read More »
On Key

Related Posts

Map shows South Korea with waterways highlighted. In the top right corner is a north arrow and in the bottom left corner is a legend of different rivers in South Korea.

Monitoring Water Quality in South Korea

South Korea is facing a water quality problem. Researchers Hyunglok Kim and Seongjun Lee from the Gwangju Institute of Science and Technology (GIST) embarked on developing a model to predict water quality indicators in near real-time.

Read More »