
Dr. Zachary Brecheisen is a post-doctoral research associate at Purdue University. Here is what Zach shared with us about the work he is presenting today at #AGU19:
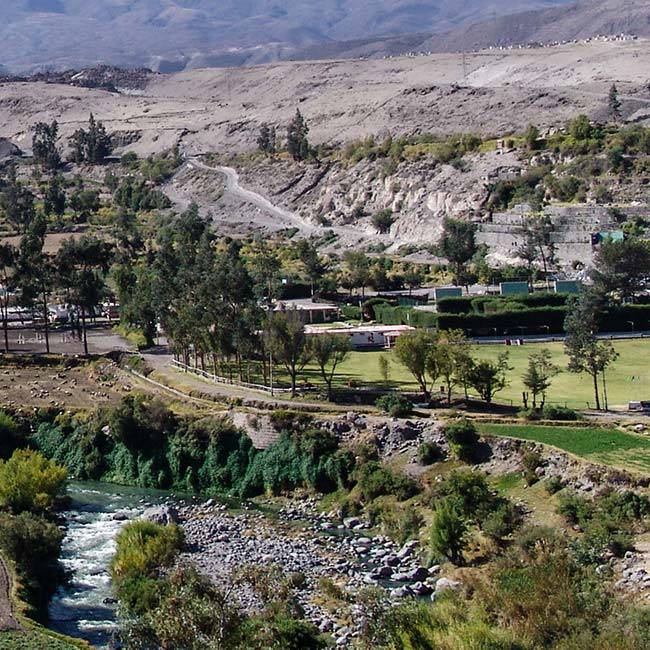
Nexus Institute: Quantifying four decades of arid-region agricultural development in Arequipa, Peru using Landsat
What are the major findings of this research?
Some of the most important findings in this project thus far are:
1) Relative to both alluvial valley bottom agriculture and terraced agriculture which are relatively constrained by topography and have a history stretching back centuries in many places, modern intensively managed and irrigated agriculture has nearly doubled over the last 35 years.
2) Tropical alpine wetlands, though covering just 1.5% of the landscape likely contain 1/3 of all soil carbon across the region.
3) With medium resolution satellite imagery like Landsat, there can be challenges in terms of ground-truthing and validation of classified features, but when paired with low-cost high-resolution historical satellite imagery like that of CORONA/Keyhole (~3 meter pixel resolution) spanning the 1960s-1980s, the ability to validate and improve Landsat-based land cover classification is greatly enhanced.
What are the implications of your findings?
This remote sensing work provides the temporal context within which the socio-economic and ecological situation of intensive agricultural expansion continues to unfold. As we proceed with whole-region vegetation land cover classification we stand to learn much more about the coupled human-environmental evolution of the landscape. Some areas downstream of the intensively managed upland fields have experienced salinization and runoff of fertilizers and pesticides, though the magnitude of this is still being studied.
As concerns of climate change and carbon sequestration continue to mount, the protection of existing carbon stocks is increasingly important, so accurate estimates of alpine wetlands and their change through time will be increasingly valuable.
Finally, we hope to highlight the utility and affordability of declassified 1966 ~3 meter resolution CORONA imagery costing just 0.37¢ per km2 versus $0.45 per km2 for 10 meter resolution panchromatic SPOT satellite imagery. Though archaeologists have utilized this this type of imagery for mapping, we hope to demonstrate its utility in environmental studies.
What insight did you gain from NASA/USGS Landsat that would have been difficult to ascertain otherwise?
There is no satellite record that has the temporal reach of Landsat. While new satellite- and aircraft-based sensors are coming online with sub-meter resolution offering more and more spectral bands, none of them allow the types of temporal investigation that the combined generations of Landsat offer. This paired with Google Earth Engine’s incredibly powerful ability to render cloud-filtered mosaics and composites spanning a dozen or more Landsat tiles at user specified time-steps in seconds revolutionizes our ability to study multidecadal landscape land cover change back into the 1970s.
Why has there been an agricultural explosion in this area of Southwestern Peru over the last 40 years?
The Peruvian government has sponsored and encouraged most of these agricultural development projects as a means of economic development and job creation. It entailed massive feats of engineering to re-route and deliver water from the highlands down to green the desert below. Though there was extensive research and planning in the design and execution of this project, the Peruvian government values sustainability and has thus funded the Arequipa Nexus Institute, a joint partnership between the University of San Augustine in the city of Arequipa and Purdue University in the US focused on sustainability research and capacity building.
Co-authors:
Nicholas Hamp-Adams
Purdue University
Timothy R Filley
Purdue University
Edwin Bocardo Delgado
University Nacional de San Augustine
Darrell G Schulze
Purdue University
Funding for this work provided by the Arequipa Nexus Institute for Food, Energy, Water, and the Environment through the National University of San Augustine in Arequipa, Peru.
Anyone can freely download Landsat data from the USGS EarthExplorer or the LandsatLook Viewer.
Further Reading:
+ Landsat at the 2019 AGU Fall Meeting


