Search
Close this search box.

Quickly Assessing the Aftermath of Hurricane Ian with Satellites

Quickly Assessing the Aftermath of Hurricane Ian with Satellites

By Elaina Hancock, UConn Today

Editor’s note: This work relies on data from the Harmonized Landsat Sentinel-2 (HLS) data product. HLS incorporates Landsat 8 and Landsat 9 data with data from the European Space Agency’s Copernicus Sentinel-2A and Sentinel-2B satellites to provide an ~1.7-day data refresh. This work demonstrates the fast, targeted disaster monitoring that is enabled with increased satellite revisit time (temporal resolution).

Map of likely Hurricane Ian damage
A disturbance probability map of Florida’s peninsula as of October 3rd, 2022. The HLS-based analysis reveals a large-scale damage pattern for Florida and indicates where damage hotspots are. Image credit: Su Ye, UConn GERS Laboratory

The southeast is reeling from Hurricane Ian, the fifth largest in United States history, which made landfall on the Florida coast on September 28th. At least 109 people in the US have been reported killed by the Category 4 hurricane, with 105 of those deaths occurring in Florida, where efforts to locate survivors are still ongoing.

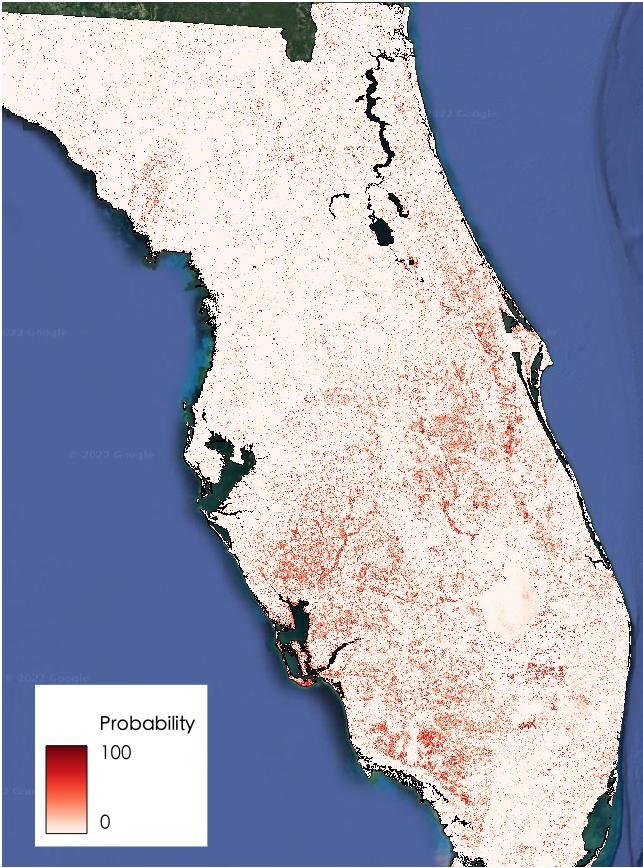
UConn researchers from the Department of Natural Resources and the Environment Global Environmental Remote Sensing (GERS) Laboratory have created the first high-resolution land disturbance map detailing damage wrought by the hurricane’s wind and storm surge using a 30-meter Harmonized Landsat Sentinel-2 (HLS) dataset. The platform used to build the map is open source and released just days after the storm, the researchers hope the information provided by the map can aid teams on the ground in the search and recovery efforts.

The map was made using methods based on previous research by the team to monitor forest disturbances. They use images from satellites that scan the Earth’s surface every eight days, where each pixel represents an area measuring 30 meters-by-30 meters and contains a multitude of information. The challenge is searching through that information to understand what is happening at ground level. The algorithms developed by the GERS team sort through the data to detect even slight changes.

Areas damaged by Hurricane Ian
The potentially damaged regions (yellow polygons) in Fort Myers beach mapped the UConn GERS Laboratory using HLS data and a change detection algorithm developed by the lab. Image credit: Su Ye, UConn GERS Laboratory

Following the storm, Post-Doctoral Researcher Su Ye says they were ready for the data.

“We were waiting for the first clear optical satellite imagery released by NASA this Sunday, Oct. 2,” Ye says. “Once the first post-disturbance imagery was published online, our system was ready and capable of automatically delineating the new disturbance regions by comparing the new imagery and the surface reflectance model stored in our system within one day.”

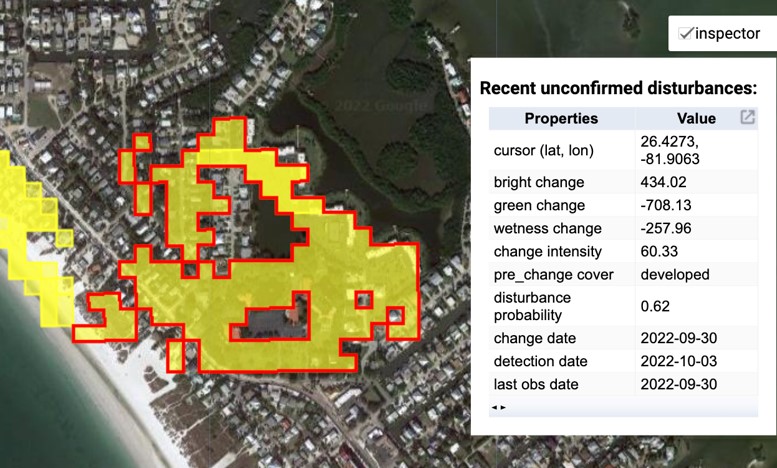
Ye developed the platform, which provides location and timing information about the disturbances, but also includes spectral change properties such as wetness and greenness and indicates what kind of structures or surfaces were present pre-disturbance, says Assistant Professor and Director of GERS [and Landsat Science Team member] Zhe Zhu.

Ye explains when disturbances occur, a certain level of surface reflectance change could be often observed and captured by satellite imagery:

“However, the disturbance signals were often mixed with other noise signals relating to atmospheric calibration process or other non-disturbance physical processes, so it often requires several consecutive anomaly observations to guarantee the highest mapping accuracy. The more anomaly observations identified, the more accurate they are, but with more latency for near real-time disturbance mapping.”

When faced with life-or-death situations such as the rescue efforts following a disaster, time is of the essence, and Ye says their system starts to map disturbance even if only one anomaly observation is available. Then, subsequent anomaly observations will be flagged and marked as “confirmed” and will be stored in the database.

When parsing through so much information, algorithms can automatically identify changes, and other GERS innovations help with the massive amount of computing and data storage that analyses like this require.

“We used a key algorithm we developed called ‘Stochastic Continuous Change Detection’ (S-CCD),” Ye says. “S-CCD is a near real-time adaption of the flagship time-series algorithm ‘COLD’ (COntinuous Land Disturbance monitoring) Zhe developed.

“The biggest innovation of S-CCD is that it recursively updates the model coefficients based on a mathematic tool called ‘Kalman filter’ which removed the need of historical satellite dataset storage and significantly boosted processing efficiency for near-real-time scenarios. These features enable us to operationalize large-scale land disturbance monitoring with the daily update of disturbance progress, using small-scale computing facilities of non-profit organizations such as UConn. Latency is the most important for near real-time monitoring. We are continuing to innovate on the engineering part, which will eventually impact our map delivery timeliness,” Ye says.

The map shows pixels of yellow overlaid on the satellite image of the state of Florida, the yellow indicating all recent unconfirmed disturbances after hurricane Ian.

Zhu explains that presently, they are all the “potential” damaged or flooded areas with at least one anomaly observed in the HLS data, which is why they are calling them the “unconfirmed” disturbance. This approach has been extremely useful and accurate in previous studies of disturbances.

“For those patches that are still in process of collecting anomaly observations, their geometry and properties will be updated with the new imagery until they were confirmed,” says Ye. “Though only a couple of anomaly satellite observations have been collected, ‘recent unconfirmed’ patches were still at an acceptable accuracy level (~84% overall accuracy, 6% lower than ‘confirmed’).”

Ye says the rest of the patches, currently categorized as ‘unconfirmed disturbance’ will be analyzed further in the coming weeks as more images come in.

“We could find ‘site-level’ hotspots through analysis of disturbance patches and probability maps and then combine high-resolution Planet imagery to accurately locate those severely impacted regions,” says Ye. “We will continuously update the change of disturbance patches; the patch properties, such as ‘wetness’, are useful for tracking the post-hurricane flood. We also share the free download link for near real-time dataset on our website, so that other agencies could customize their own analysis.”

On Key

Recent Posts

Earthrise

Remembering Bill Anders

Anders, 90, the astronaut who captured the iconic Earthrise photograph, died on June 7, 2024, when the plane he was piloting crashed into the San Juan Channel.

Read More »
On Key

Related Posts