To put this pattern of forest decline into historical perspective, investigators at NASA’s Ames Research Center in California’s Silicon Valley published a study in April 2016 in the Journal of Earth Science & Climatic Change. The paper documented NASA’s unique three-decade record of vegetation cover change from the Landsat satellite and analyzed a series of detailed yearly maps to compare previous controls on forest growth rates and effects of recent fluctuations in water availability since the mid-1980s. Operating since the 1970s, the Landsat Earth-observing mission is operated jointly by NASA and the U.S. Geological Survey.
“NASA’s satellite record offers abundant evidence that extensive tree die-back from the historically low water years of 2013 to 2015, combined with numerous large stand-replacing wildfires in the Sierra region, has essentially reversed the impressive accumulation of live tree density state-wide that we were tracking since the early 1980s,” said the study’s lead author, Christopher Potter of Ames.
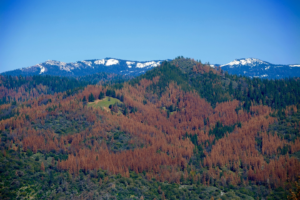
Three decades of forest growth was erased by the drought’s impacts over much of the lower-elevation Sierra Nevada mountain region in the past couple years.
The U.S. Weather Service defines drought as a deficiency in precipitation over an extended period resulting in water shortages that cause adverse impacts on vegetation, animals and people. The calendar year 2013 was the driest on record, with a total of just 30 percent of average statewide precipitation. A record low snowpack level in 2015 in the Sierra Nevada Mountains was unprecedented in comparison to the past 500 years – typical snow water levels in 2015 were detected at just five percent of the historical average.

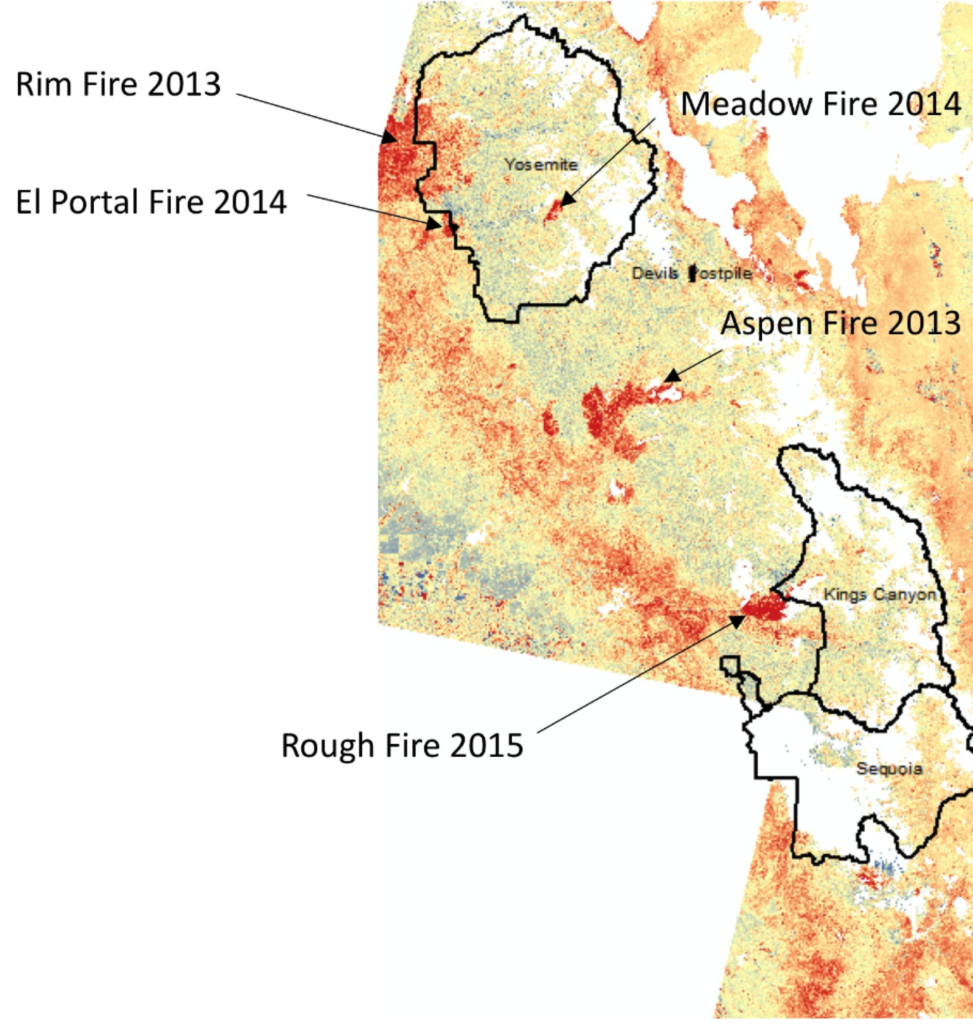
According to the satellite data, areas most severely impacted by constant water shortages were located just southwest of Yosemite, Kings Canyon, and Sequoia National Parks, and in the Sierra and Sequoia National Forests. The Landsat satellite data values at dying tree locations nearly resembled those from charred forest stands burned in the 2013 Rim Fire near Yosemite and the 2015 Rough Fire near Kings Canyon National Park.
This won’t be the end of the analysis of these regions. Potter says that Landsat images are provided by NASA at no cost to researchers every two weeks. “Our continued analysis of this unique, reliable satellite data over the next several years at these same Sierra aerial survey locations should help inform forest and park managers about the potential for further, delayed tree die-back,” Potter said. “It will also enable us to efficiently track subsequent recovery and regrowth rates of drought-affected forest stands during more favorable precipitation years.”
Further Reading
+ Landsat Image Analysis of Tree Mortality in the Southern Sierra Nevada Region of California during the 2013-2015 Drought [PDF]

Be Part of What’s Next: Emerging Applications of Landsat at AGU24
Anyone making innovative use of Landsat data to meet societal needs today and during coming decades is encouraged to submit and abstract for the upcoming “Emerging Science Applications of Landsat” session at AGU24.


