Search
Close this search box.

Determining patterns and extent of turbidity

Determining patterns and extent of turbidity

Location: Chao Phraya River, Thailand
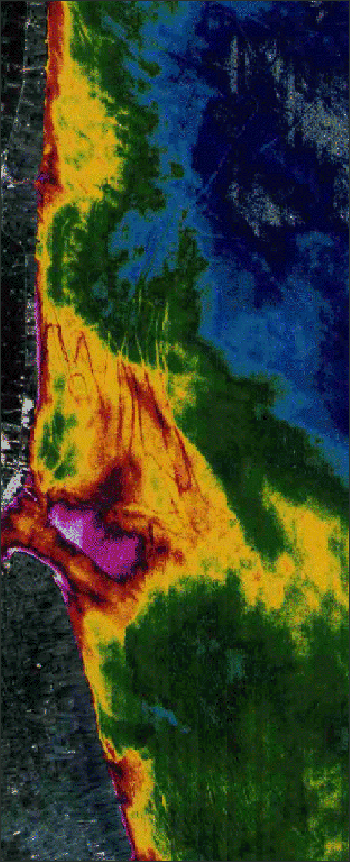
Sediment densities in the Gulf of Thailand at the mouth of the Chao Phraya River.
Sediment densities in the Gulf of Thailand at the mouth of the Chao Phraya River. Image acquired December 14, 1990. Image data courtesy of Thailand National Research Council. Image data processing by the Environmental Research Institute of Michigan.

Landsat TM image showing sediment in the Gulf of Thailand at the mouth of the Chao Phraya River. Colors represent different concentrations of sediment. Sediment load in rivers can be affected by land-use practices and rainfall variations. The curving horizontal lines are “trails” of sediment stirred up by trolling fishing boats.
On Key

Recent Posts

Spectral Characterization

The measured wavelength locations of the ETM+ spectral bands are compared to Landat 5’s TM in Table 8.1 The spectral bandwidths are determined by the combined response of all optical

Read More »
On Key

Related Posts

Spectral Characterization

The measured wavelength locations of the ETM+ spectral bands are compared to Landat 5’s TM in Table 8.1 The spectral bandwidths are determined by the combined response of all optical

Read More »