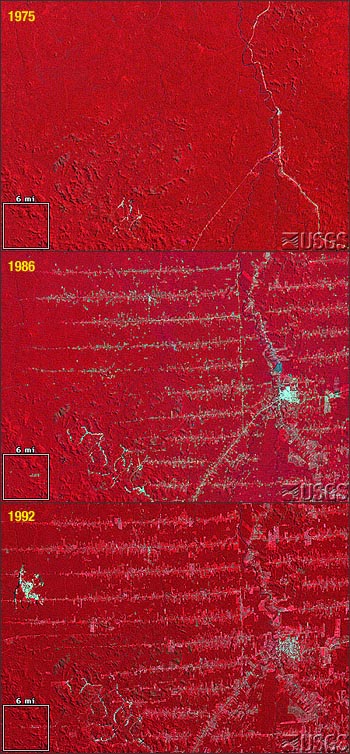
Location: Rondônia, Brazil
Source: USGS Earthshots

These images show a portion of the state of Rondônia, Brazil, in which tropical deforestation has occurred. The 1975 and 1986 images are MSS data. The 1992 image is TM data.
Approximately 30% (3,562,800 sq km) of the world’s tropical forests are in Brazil. The estimated average deforestation rate from 1978 to 1988 was 15,000 sq km per year. Systematic cutting of the forest vegetation starts along roads and then fans out to create the “feather” or “fishbone” pattern shown in the eastern half of the 1986 image. The deforested land and urban areas appear in light blue; healthy vegetation appears red.
Spectral Characterization
The measured wavelength locations of the ETM+ spectral bands are compared to Landat 5’s TM in Table 8.1 The spectral bandwidths are determined by the combined response of all optical

