Search
Close this search box.

Landsat Insights: Wetland History in Your Hand

Landsat Insights: Wetland History in Your Hand

By Laura E.P. Rocchio

Gingham Waterhole, Gwydir Welands at sunset. A dead tree is reflected in the water with a blue-purple sky behind it.
Gingham Waterhole in New South Wale’s Gwydir Welands. Photo credit: Sharon Bowen, NSW Department of Planning and Environment

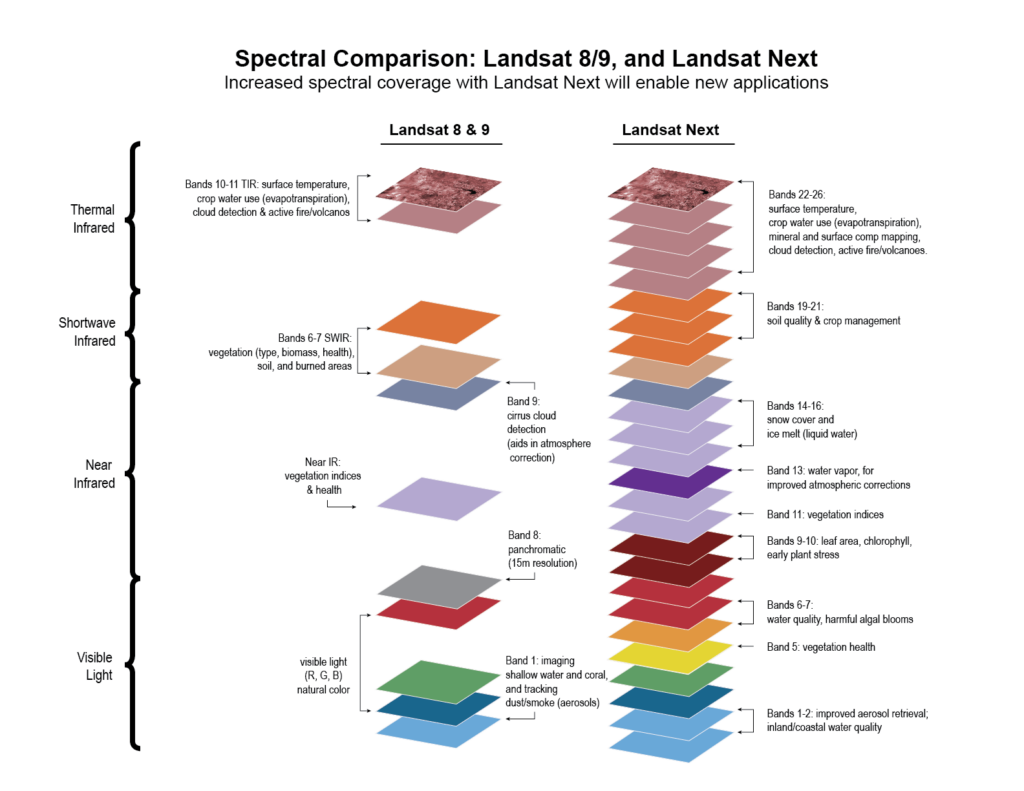
Practitioners managing the wellbeing of wetlands have a new tool at their disposal. The Wetland Insight Tool (WIT), developed by Geoscience Australia, provides a visual summary of 35+ years of wetland dynamics. By exploiting the Landsat data record to document shifts in open water and vegetation cover, the open-source tool can reveal a wetland’s natural hydrologic cycles and the impact of disturbances.

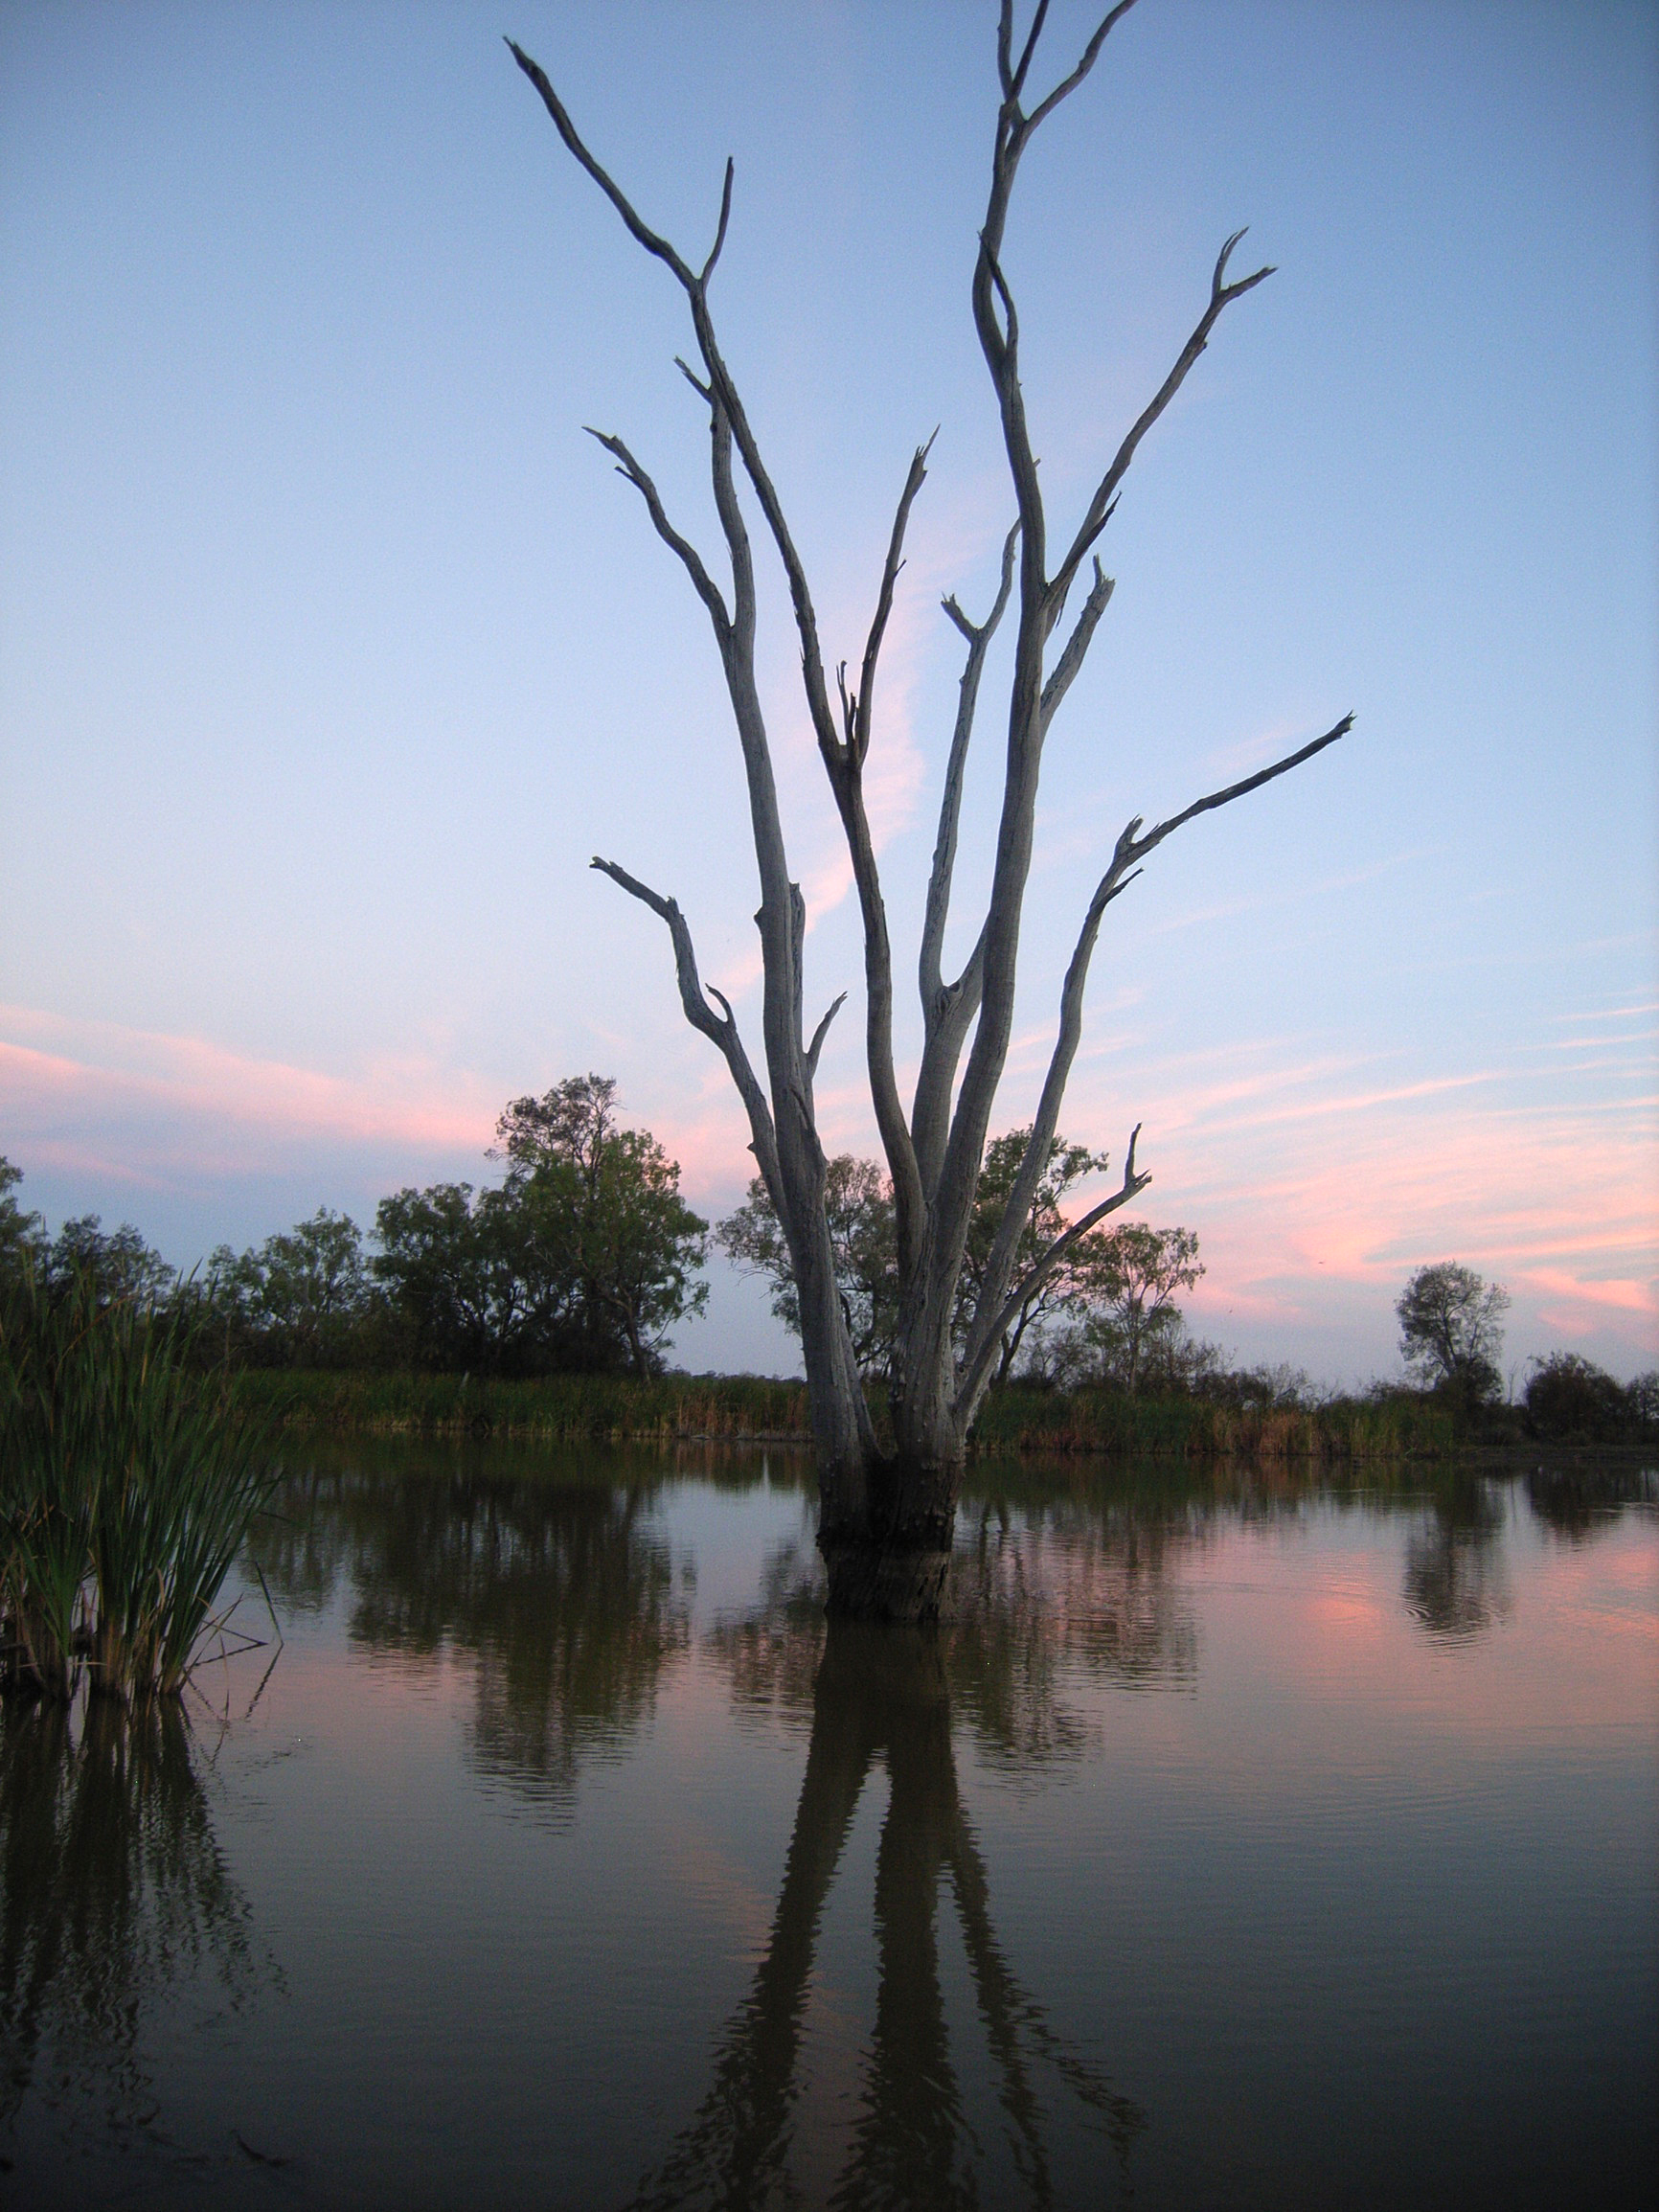
Despite being the most arid inhabited continent, Australia has a diverse range of wetlands, from tropical billabongs to alpine bogs. Sixty-seven Australian sites have been recognized as ecosystems of international importance by the United Nation’s Ramsar Convention.

Wetlands, once denounced and drained in the name of progress, are today valued for their crucial ecosystem services, and recognized by the UN as critical natural systems for reaching sustainable development goals.

Bex Dunn and Dr Fernanda Adame, Wetland Ecology Senior Research Fellow at Griffith University’s Australian Rivers Institute, conducting field observations of wetlands with UAVs (Autonomous Aerial Vehicles) on Minjerribah (North Stradbroke Island, Queensland, Australia).
Lead author, Bex Dunn, and Fernanda Adame (Australian Rivers Institute) during a field campaign on Minjerribah (North Stradbroke Island) in Queensland, Australia. In this September 2019 photo, Dunn and Adame are using remotely-controlled UAVs to make wetland observations.

“Wetlands are so important in how water behaves in the landscape, and water is so important to our survival,” said Bex Dunn, an Earth Observation Scientist at Geoscience Australia. “They’re really valuable biodiverse ecosystems, providing habitat; refuges and nurseries for birds, plants, and animals; filtering drinking water; damping floods; supporting agriculture and recreation; sequestering carbon; controlling sediment runoff; and contributing to the water cycle on our planet.”

The presence of wetlands has been dwindling over the past century. And today, wetlands are under increasing pressure as challenges of climate change mount. Prolonged drought, increased fire activity, and large swings in precipitation are intersecting with population pressures and changing flood and flow patterns as more and more water sources are dammed.

Distilling Dynamics

For wetland managers trying to maintain wetland health and the benefits they bestow on the environment, capitalizing on the long Landsat satellite record means that current wetland changes can be put into historical context.

“The Landsat data record is absolutely invaluable—wetland managers can start to understand if changes they are seeing take place over months, years or decades,” Dunn said, echoing research published in her recent paper about WIT.  “The incredible continuity of having data that goes back over 35 years can really mean the difference between knowing if a change in vegetation or hydrology might be new, or something that has been seen before in the record.”

Yellow Water Billabong at sunset. Silhouetted trees are reflected in the waters as the sunsets behind them.
Australia’s Yellow Water Billabong in the Northern Territory’s Kakadu National Park. From tropical billabongs to alpine bogs, Australia has a diverse range of biodiversity-rich wetlands. Photo credit: pen_ash, Pixabay


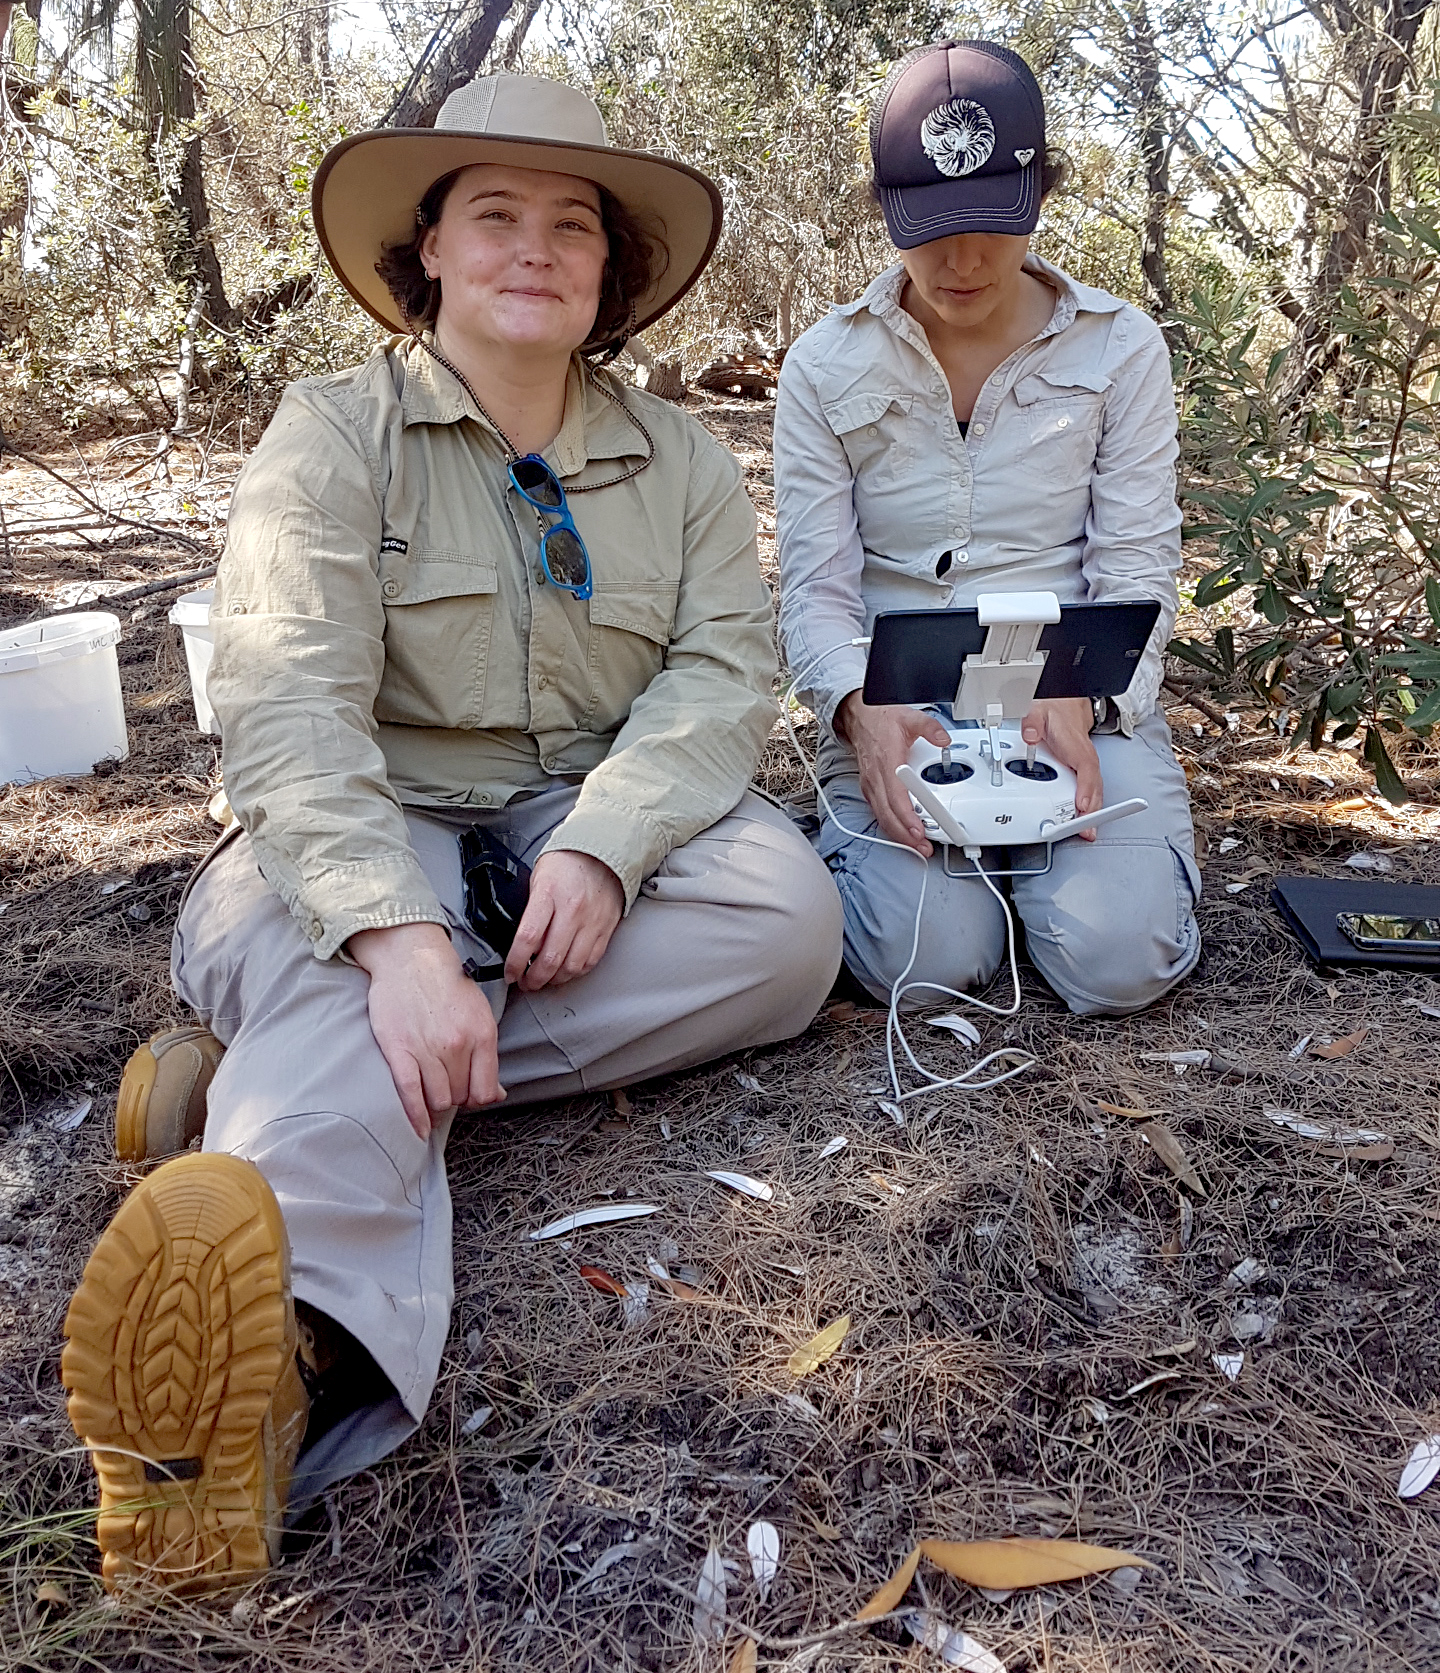
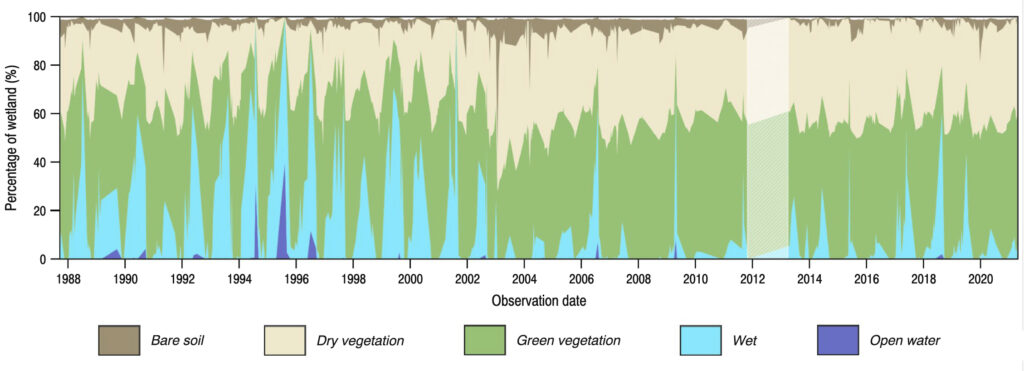
Wetlands can be challenging to survey from the ground, especially with limited resources. Knowing when and where wetlands are inundated and how surrounding vegetation responds is essential for wetland management. The WIT plots show wetlands’ hydrology and vegetation dynamics through time, giving managers the ability to see the natural variability. Seeing historical patterns helps managers better interpret their current ground-data and improves the decision-making process.

“The management of wetlands is intrinsically linked to its water regime,” Mike Ronan explained, a paper co-author and wetland manager for the Queensland Department of Environment and Science. “Any tool that assists with understanding that regime is really valuable. WIT is very intuitive and virtually everyone that sees it, understands it straight away.”

WIT enables managers to easily distill information salient to them from the Landsat data record—onset and duration of inundation events, proportion of the wetland inundated, fluctuations in inundation patterns, and vegetation response. The WIT workflow is open source, scalable, easily updated as new satellite data is collected, and can be applied to wetlands in any region.

“It is one of the greatest wetlands management tools that has become available in many years” Ronan commented.

WIT plot for Ginini Flats Wetland Complex, Australian Capital Territory.
The vegetation and hydrology history of Ginini Flats Wetland Complex in the Australian Capital Territory as displayed in a WIT plot. Note: Low data density due to the Landsat 7 Scan Line Corrector failure and decommissioning of Landsat 5 is indicated by the white shaded section. Image credit: Dunn et al., 2023

To Wit: Fire & Water in Ginini Flats

Ginini Flats Wetland Complex is a small Ramsar-recognized wetland in the Australian Alps. Twenty years ago, much of the bog was damaged. In these Landsat images, Ginini Flats Wetland Complex's location is shown with a green boundary line. A natural Landsat 8 image shows the largely recovered region on January 8, 2023. A natural color Landsat 7 image from January 25, 2003 shows the region under hazy conditions during the massive wildfires that occurred that year. Using the shortwave infrared, near infrared, and green bands from the same 2003 date, the massive expanse of burned lands can be seen in red and active fire fronts are bright orange.
Ginini Flats Wetland Complex is a small Ramsar-recognized wetland in the Australian Alps. Twenty years ago, much of the bog was damaged. In these Landsat images, Ginini Flats Wetland Complex’s location is shown with a green boundary line. A natural Landsat 8 image shows the largely recovered region on January 8, 2023. A natural color Landsat 7 image from January 25, 2003 shows the region under hazy conditions during the massive wildfires that occurred that year. Using the shortwave infrared, near infrared, and green bands from the same 2003 date, the massive expanse of burned lands can be seen in red and active fire fronts are bright orange.

Nestled in the Australian Alps, near the country’s capital Canberra, lies a Ramsar-recognized subalpine sphagnum moss bog known as the Ginini Flats Wetland Complex. The Ginini Flats wetlands filter water used by capital city residents and provide habitat for wildlife including migratory birds and the critically endangered Northern Corroboree Frog.

In 2003, wildfires severely damaged the bog vegetation. The drier, hotter, more fiery conditions attributable to climate change are a growing threat to wetlands. Sphagnum moss regeneration efforts are underway using surviving patches. Invasive plants and feral pigs also imperil Ginini Flats. Wetland managers are tasked with minimizing these threats and maximizing ecosystem resilience by controlling weeds, feral animals, protecting areas from fire as much as possible, and rehabilitating wetlands after fires strike.

A 2010 Australian Government report on the Ginini Flats Wetland Complex identified key knowledge gaps that need to be filled to improve the wetland’s management and preserve its ecological character. Information on vegetation dynamics along with the magnitude, duration, and seasonality of inundations were listed as gaps. WIT can now help fill these gaps.

In Queensland to the north, WIT plots have been created for over 270,000 wetlands across the state and made available on its WetlandInfo website. The WIT information has helped managers there evaluate the effectiveness of rehabilitation like weed removal, track drought and flood events, and identify hydrology changes and possible causes.

“The WIT information, combined with the existing Queensland wetlands mapping is a really powerful combination,” Ronan said. “The wetlands mapping plus WIT outputs are used on a daily basis by a very broad range of stakeholders, from government officers to planners and to those involved in on-ground rehabilitation and management—frankly it’s hard to know how we managed without it.”

Next Up

Landsat’s long archive of calibrated, comparable data makes WIT possible. The WIT plots benefit from a density of Landsat data. In periods when observation frequency is lessened due to cloud-cover or satellite collection problems, the output of WIT can be compromised. More data is better.

The upcoming Landsat Next mission was designed based on the data needs of Landsat end users. Landsat Next will increase observation frequency with a trio of satellites collecting data over a given place every 6-days, allowing wetland managers like Ronan to document more events like short-lived floods. The increased spatial resolution of Landsat Next (10 to 20 meters for visible, near- and shortwave infrared bands; 60 meters for thermal and atmospheric bands) will help wetland managers better chart the behavior of small wetlands like mound springs and peat bogs.

“I’m really looking forward to using the Landsat Next data to increase the utility of our wetlands products,” Dunn shared.

Spectrally speaking, Landsat Next’s new bands are also keenly awaited by wetland scientists.

“There is a lot we can do with additional surface temperature bands in wetland extent definition; with more bands in the near and shortwave infrared range we can improve vegetation and water coverage differentiation; in the visible bands we can improve vegetation variety and health analyses, and water quality and color observations.” Dunn remarked.

The expanded spectral resolution of Landsat next will also enable better mineral and soil mapping, and evapotranspiration calculations.

Landsat Next spectral band stack graphic that shows the differences between Landsat 8/9 and Landsat Next.
Landsat Next will have acquire 26 bands, 15 more bands than the the two previous satellite observatories. Image credit: NASA Landsat Communications and Public Engagement Team.

“We have so many options with Landsat Next, to add additional information and context to support our wetland managers as well as continuing the historical record of change and variability of our wetlands,” Dunn shared.

“I have really appreciated being able to use Landsat data as a ‘time machine’ to understand our changing environment.”

Reference

Dunn, B., Ai, E., Alger, M.J. et al. Wetlands Insight Tool: Characterizing the Surface Water and Vegetation Cover Dynamics of Individual Wetlands Using Multidecadal Landsat Satellite Data. Wetlands 43, 37 (2023). https://doi.org/10.1007/s13157-023-01682-7

Data to Info for Impact banner image.
WIT is a prime example of the ability to turn open Landsat data into information that can help resource managers and decision makers positively impact our world. (This graphic shows a January 2003 Landsat 7 image of wildland fire burn scars near Ginini Flats Wetland Complex (left), a WIT stack plot showing Ginini Flats' landcover history (center) and a photo of the endangered Northern Corroboree Frog (right). Frog photo credit: Australian Capital Territory 2017 Ginini Flats management plan.)

Banner Image Caption: Australia's Yellow Water Billabong. Photo credit: pen_ash, Pixabay

On Key

Recent Posts

On Key

Related Posts